
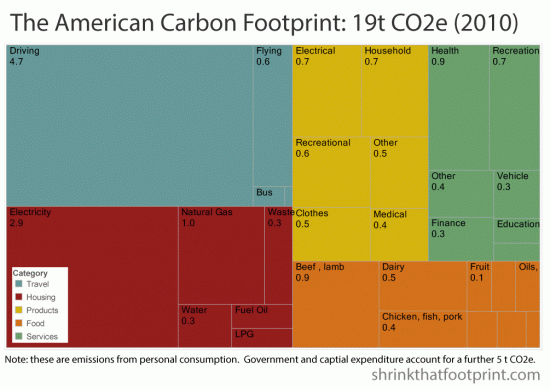
The chart shows a rectangle broken into smaller rectangles proportionate to their carbon contribution. The breakdown follows: Approximately a quarter of the rectangle is categorized as ‘travell,’ with most being contributed to driving. Little more than a tenth of the travel portion is flying, less still for buses, and then remnant portions. Another quarter of the larger rectangle of broken into a housing category. Over half of housing is contributed towards electricity, and then, in descending order, natural gas, water, waste, fuel oil, and LPG. The remaining portion of the rectangle is dicided between products, food, and services. Notable here is that one third of the food portion is beef and lamb, and another third is for dairy, chicken, fish, and pork.