
Opening Questions
-What role does renewable energy play in sustainable housing?
-Can the Sun’s energy viably power the American way of living?
-Why is solar PV suddenly a solution (and a good investment)?
-How do economic and regulatory environments impact solar viability?
-How does solar PV pay off over time with such a high upfront cost?
-If solar PV is such a good investment, why isn’t there more of it?
-How is the environmental impact of fossil fuels accounted for?
-What are the advantages of producing energy where it is used?
-How are the problems of intermittent solar energy addressed?
-What is the role of electric utilities in provisioning household solar?
Introduction
“Every 24 hours, enough sunlight touches the Earth to provide the energy for the entire planet for 24 years” – Martha Maeda. This gives evidence to the tremendous power of the sun, and it’s potential adequacy for energy needs on Earth. We don’t often think of fossil fuels as renewable or solar energy, but they are. It was the sun that fueled the growth of organic matter on Earth, aided in the lifecycle and decay process, and led to the geological conditions that trapped and pressured the material into the reserves we now tap as oil, coal, and natural gas. Unfortunately the planet has been imperiled by the extraction of millions of years worth of solar energy in a mere fraction of the time that it took to accumulate. Our tremendous ecological challenge today is that we have, in just the past 150 years, exploited a millennial measure of solar energy, far too rapid for the renewing cycle of fossil fuels and the natural capacity of the planet to absorb and safely process the enormous quantities of CO2 emitted from burning them. Our goal must now be to find ways to live each day within a daily dose of the sun’s energy; fortunately, the source is sufficient, and improving solar capture technologies make that possible today and desirable from both an economic and ecological perspective..
Falling Prices of Solar
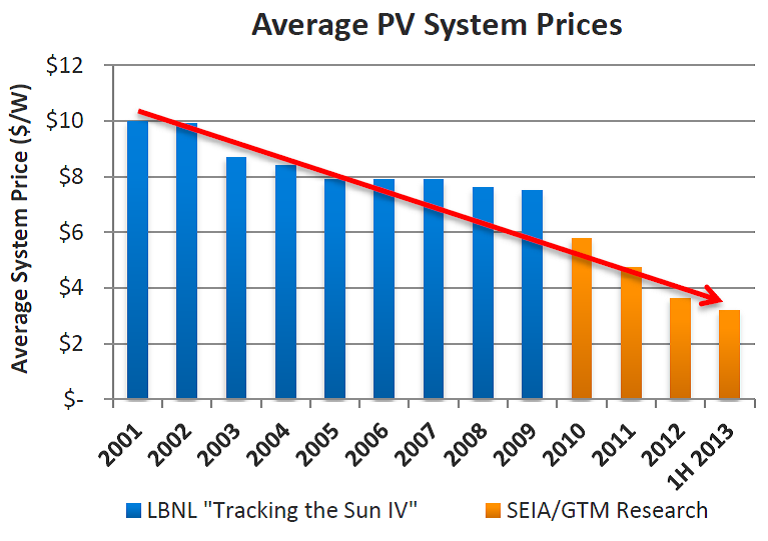
After steady, but modest declines through 2007, prices for solar PV then began to fall dramatically; modules alone fell more than 80% since 2008 (Miroff, 2017). The U.S. Department of Energy reports that the average installed cost of solar photovoltaic PV systems fell 43% between 2009 and 2012, shown below (Clemmer, 2013). This trend continued with annual price reductions of 15% in 2013 (Feldman et.al., 2014), 20% in 2014 (Weiner, 2015), 12% in 2015 (Weiner, 2016) and 18.3% in 2016 (Weinschenk, 2017).
Historical record of Solar PV
Active solar refers most often to photovoltaic (PV) cells that turn sunlight into electricity. This effect was discovered by Alexandre Edmond Becquerel in 1839 (Energy Matters, 2017), and the solar cell was invented about a hundred years later (in 1941) by Russell Ohl. These innovations were groundbreaking, yet the early development of solar PV offered inefficient production at prices too high to compete with a burgeoning fossil fuel industry. Steady advances in technology and efficiency, and reduction in costs, have only recently made solar PV cost-effective and competitive on a broad scale. The cost and production of solar PV varies according to the unique features of each installation, including geographic latitude, local weather, and characteristics of the array such as module type, pitch (angle), azimuth (orientation), and size. Regardless of the micro variation by installation, the macro trends of better performance and lower prices are clear and pronounced.
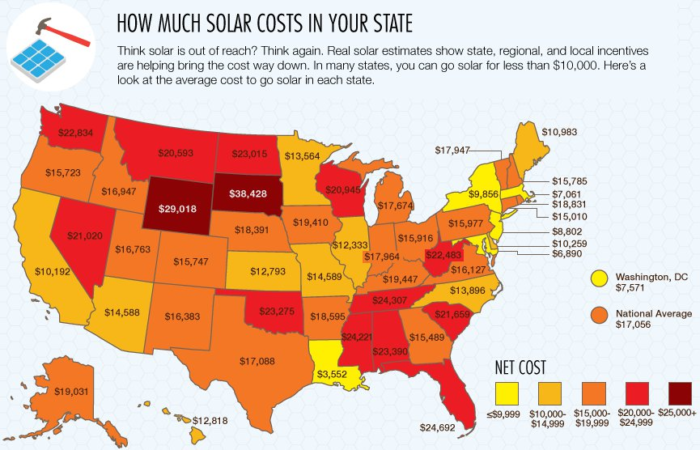
Economic incentives, such as rebates and tax credits are factored into installed pricing. The U.S. federal government has offered a solar Investment Tax Credit (ITC) since 2006; it provides a credit of 30% of the installed price, captured through federal income tax filing. The ITC remains available for new solar PV systems through 2019 at the full 30% credit, after which it is set to phase out to 26% in 2020 and 22% credit in 2021 (DOE, 2017). If the ITC is not renewed or extended, it will expire at the end of 2021. Some states offer additional rebates or credits, and some utility policies provide further incentives or, in some cases, disincentives. Below is a U.S. map of installed prices by state, combining federal and state incentives (Clean Power Research, 2012); this reveals the significant variability in cost for the same system in different regions.
Since the economics and solar potential varies somewhat by region, we provide several snapshot locations across the country, starting with the actual installation at the case study residence. This opening case demonstrates the economic viability of solar PV even when conditions are far from optimal. In early 2017 a 7.08 kilowatt (KW) system was installed on a newly constructed home in western Virginia. Virginia offers no statewide incentives for residential solar, and there were no regional or utility rebates; the only economic assistance was the 30% federal ITC. Additionally, while the average cost of distributed electricity in the United States is 12 cents per kilowatt-hour (kWh), the electric utility with jurisdiction over this installation assesses a below-average rate of ten cents/kWh; lower grid rates make the environment more competitive for solar PV. Finally, the location falls on the border between Zones 4 and 5 on the U.S. Solar Insolation Map to the right.
Western Virginia isn’t the worst location in the U.S. to install solar, but it is well below average on the economic viability scale for the three reasons noted above; however, even in this setting the economics favor solar. Two additional project conditions that were less than optimal are that the array needed to be set 16 degrees from optimal pitch and nine degrees from optimal azimuth (true south).
With careful planning, a residential PV system of this size can be installed for about $2.50 per watt; roughly $1.50/watt for materials, and $1/watt for labor. At $2.50/watt, the 7.08 KW system cost $17,700 initially, but after the federal tax credit (30%) of $5,310 the final net cost was $12,390. The economic gain, or offset, is the value of the electricity produced by the system and therefore not purchased from the utility; this is about $900/year in the first year, with its local characteristics, and a rate of $0.10/watt which must be pegged to the comparative utility grid rate. This system was designed to provide at least 100% of the annual electric demand for the household, including transportation by charging an electric vehicle (EV).
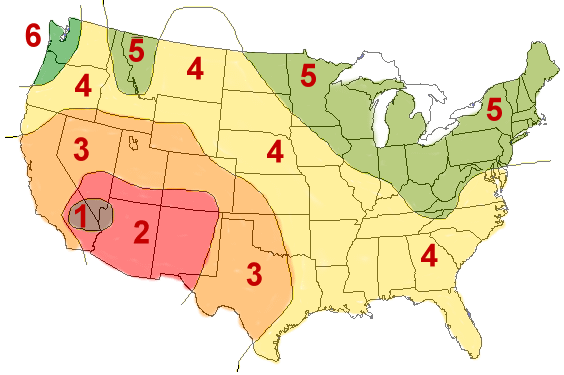
This map is an indicator of solar capture potential across the U.S.; the zones correspond to the amount of solar insolation, which is a rating of full sun hours per day, averaged over a full year as follows:
Zone 1 – 6.0 hours
Zone 2 – 5.5 hours
Zone 3 – 5.0 hours
Zone 4 – 4.5 hours
Zone 5 – 4.0 hours
Zone 6 – 3.5 hours
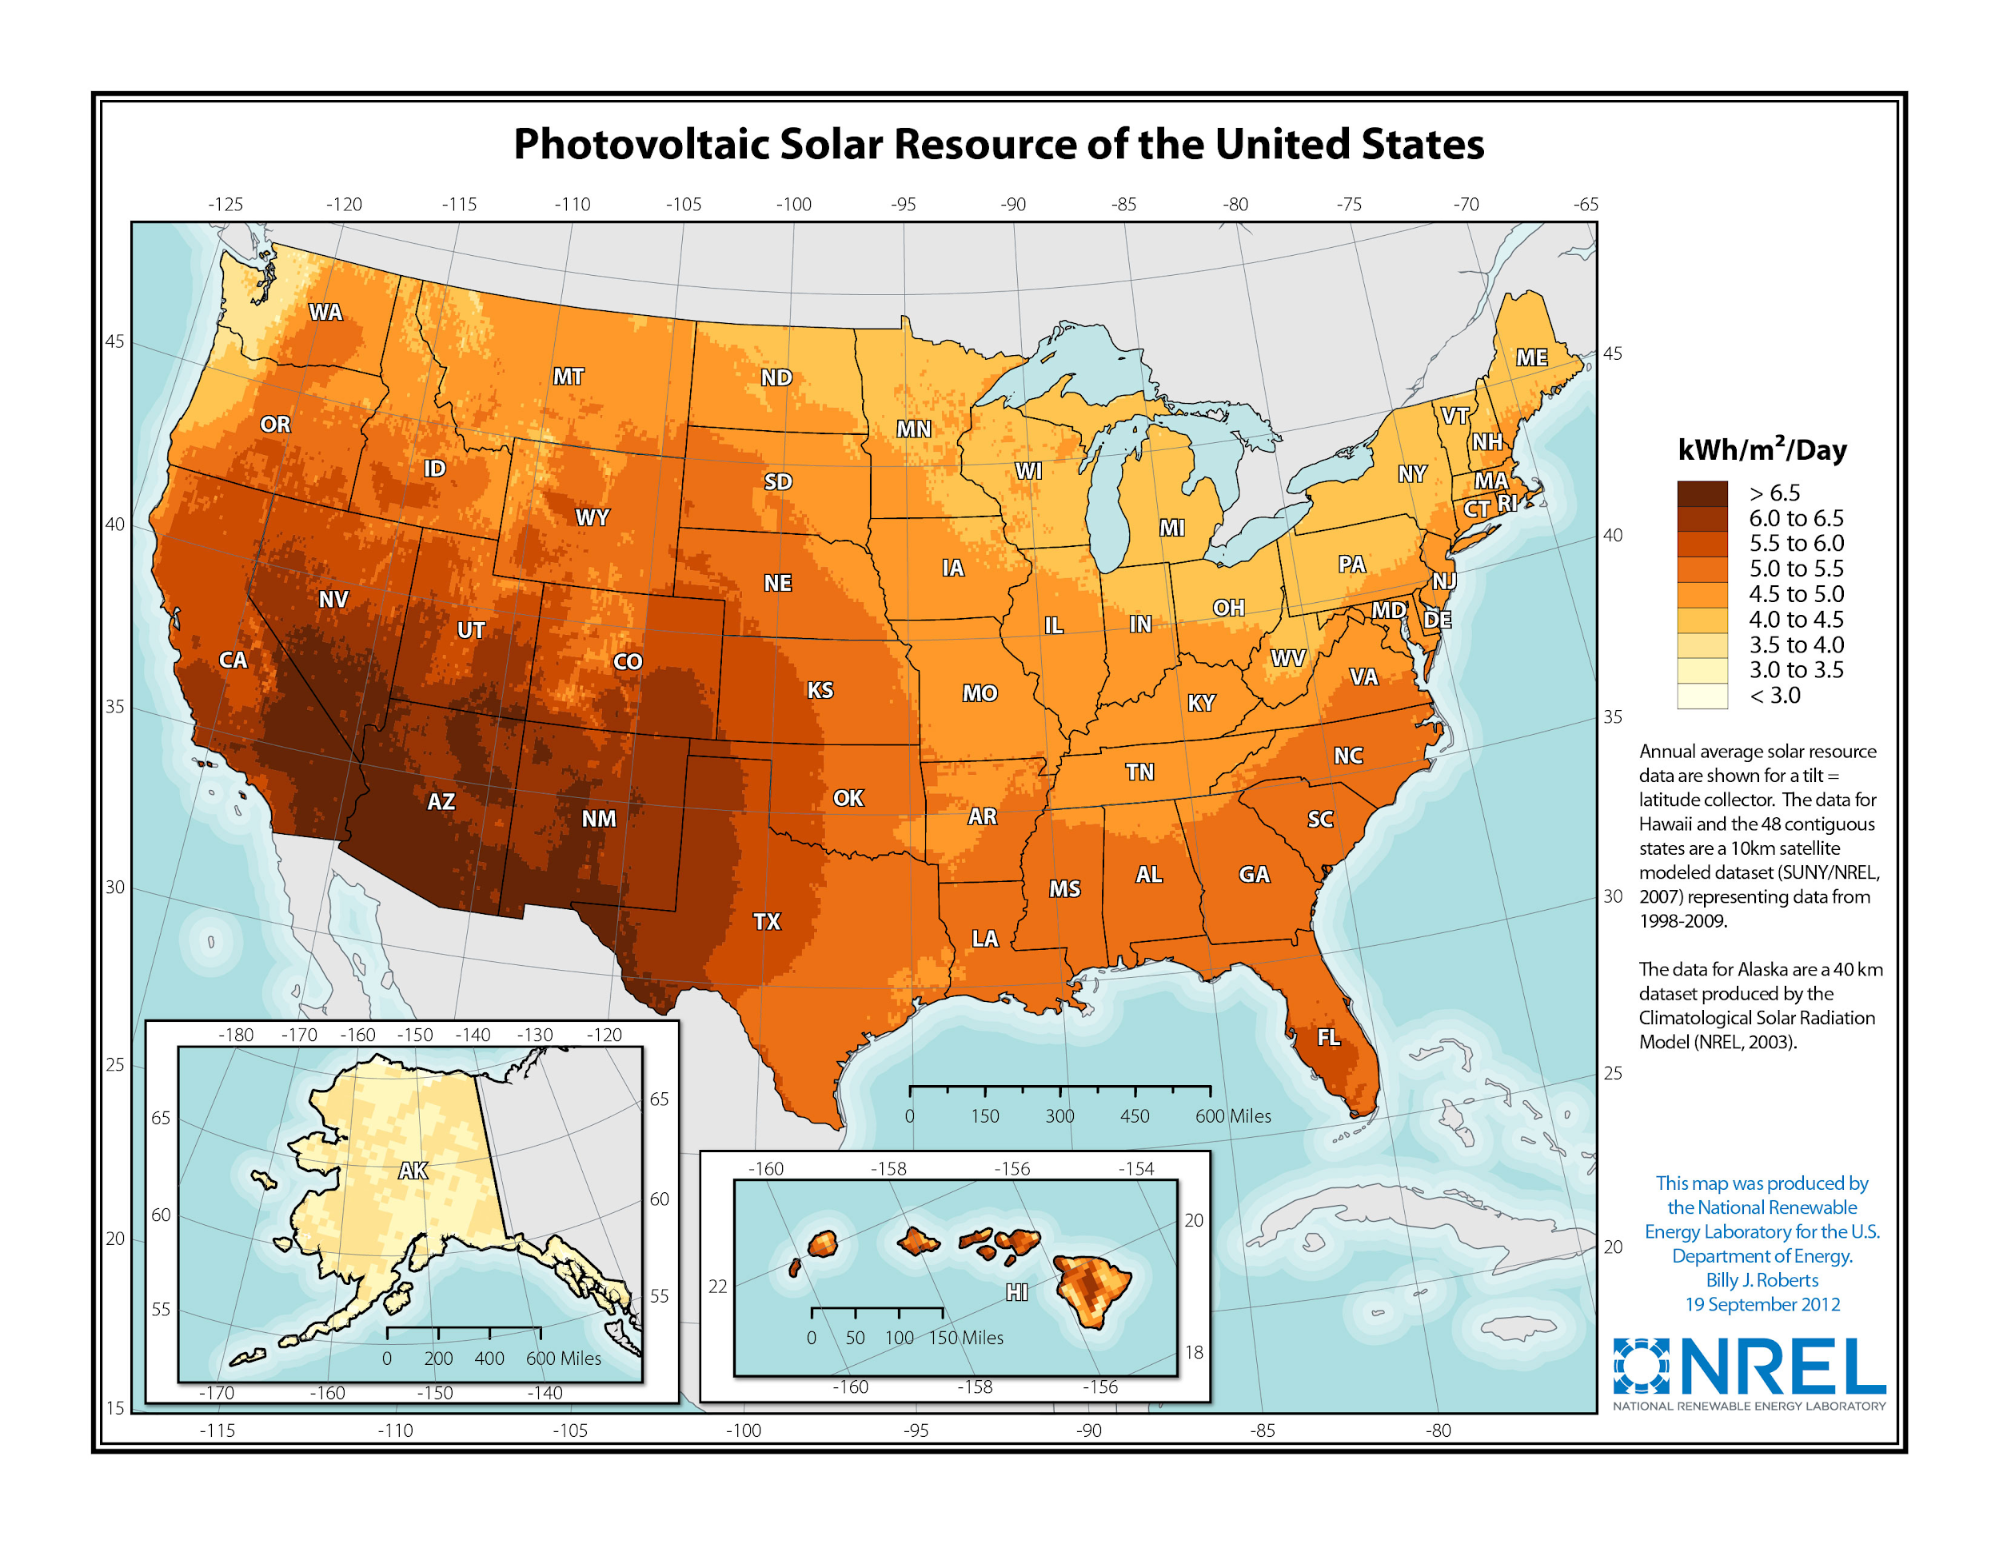
Below is a another map of the United States showing the potential solar power to be gathered.
Economic Payback Models
There are several ways to evaluate the economic implications over time. A simple payback model would divide the net investment ($12,390) by the annual benefit ($900) to arrive at a simple payback period of 13.77 years. In other words, the investment will have paid for itself in less than 14 years, when the solar array is only half way through its warranted life. While solar panel production degrades slowly over time, modules today are expected to continue producing significant energy well beyond their warranted 25-30 years.
A more complicated, but more realistic, payback model accounts for module degradation, as well as the opportunity costs of the investment and projected increase in grid utility rates, due to inflation and other factors. Overall average annual inflation in the U.S. has run at 3% since World War II. Energy inflation has run slightly higher, but 3% is often used as a conservative estimate for solar investment analysis. Most manufacturers warrant their modules for a maximum degradation rate of 0.5% (0.005) per year, though it is generally observed to be closer to 0.3% in recent years. The opportunity costs (or cost of funds) can be considered in two ways. First, if the homeowner chose to allot existing funds to a solar purchase, those funds are then not available to be invested elsewhere, and the opportunity cost is the next best alternative forgone; in this case, return on the $12,390 net outlay in some other investment. A second way to think about opportunity costs is if the funds for the solar investment are borrowed. This could be a direct loan from a bank, a home equity loan, or considered part of the construction of a new home and therefore included in the mortgage. Using a cost of funds rate of 4.5% (an average rate between these three mechanisms in early 2017), module degradation rate of 0.3%, and an energy inflation rate of 3%, this model predicts a payback period of 17.4 years.
If financed by a 30-year loan instrument like, for example, part of the mortgage, the monthly payment on that portion of the loan is less than the monthly electric bill offset now by solar power production. In the case above, the monthly payment of $62.78 is paid to the bank instead of $75.00 (monthly average) paid to the electric utility. The fixed-rate loan means that the payment never increases, while electric rates are expected to rise at least as fast as general inflation at 3%. Instead of paying $900 in Year-1 to the local utility, the homeowner pays $753.34 to the lending institution. Over the 30 year life of the loan, the homeowner would pay $22,600 to the lender, but will have saved $40,737 that would have otherwise been paid to the electric utility; a difference of $18,137. Additionally, if the annual savings are placed in investment instruments returning the same 4.5%, the 30-year savings increases to $30,024. If the invested savings earn 10% annual average return, the net benefit balloons to $63,633! This example demonstrates the economic advantage of solar even in Zone 4-5, with below average grid rates, and no rebates or credits other than the federal ITC. If solar PV is economically beneficial in this location, it becomes even more advantageous for:
- Locations with better solar insolation/zones (80% of the U.S. falls in Zones 1-4)
- Higher utility electricity rates (about 90% of Americans pay more than $0.10/kWh)
- Locations with better or more incentives (about 30% of the U.S offers more than VA)
- Higher energy users, providing a larger offset (about 95% of American households)
- A larger PV system (unit costs fall with larger systems due to economies of scale)
To understand the differences across solar zones, grid rates, and state incentives the following chart shows six specific locations across the United States, and the performance and financial returns for the same 7.08 KW system outlined above; that case is also shown as a benchmark. In the remaining five cities, the array is assumed to be at optimal pitch and azimuth, and this analysis takes into account actual data for local weather, latitude, and solar incentives.
Location for 7.08 KW PV
Latitude and Insolation
Output/year Grid rate
Net cost and loan pmt.
Value elect. generated
Net benefit in first year
Less spent over 30 years
Invest savings at 4.5% rtn.
Invest savings at 10% rtn.
30-year ROI ann. avg. rtrn.
Rockingham,
Virginia
38° North
Zone 4/5
8,677 kWh
$0.10/kWh
$12.390
$753/yr.
$900/yr.
predicted
$146.66
$18,137
$30,024
$63,633
9.5%
Kansas City,
Missouri
39° North
Zone 4
10,190 kWh
$0.11/kWh
$11,208
$681.47/yr.
$1,221/yr.
predicted
$539.53
$34,823
$61,510
$142,348
14.7%
Boulder,
Colorado
40° North
Zone 3/4
11,251 kWh
$0.12/kWh
$12,098
$753.59/yr.
$1,350/yr.
predicted
$614.41
$39,039
$69,099
$160,329
15.1%
Sacramento,
California
39° North
Zone 3
10,917 kWh
$0.18/kWh
$7,822
$475.60/yr.
$1,965/yr.
predicted
$1489.40
$74,676
$136,833
$331,257
37.3%
Phoenix,
Arizona
33° North
Zone 2
12,447 kWh
$0.12/kWh
$11,208
$681.47/yr.
$1,494/yr.
predicted
$812.53
$47,180
$84,558
$199,238
18.2%
Las Vegas,
Nevada
36° North
Zone 1
12,780 kWh
$0.12/kWh
$16,149
$981.90/yr.
$1,534/yr.
predicted
$552.10
$39,978
$69,607
$158,157
12.7%
Given the six snapshots above, it is not surprising that California leads the nation in solar production, at 13,281 megawatts (MW) in 2015 (CRP, 2016), enough clean energy to power 3.32 million homes. The second largest solar-producing state is also not surprising, given the data shown here; Arizona produced 2,303 MW of solar energy in 2015, enough to power 327,000 homes. Based on known information today, and the assumptions built into this 30-year model, installing solar PV is a fantastic investment across most of the U.S., and that is strictly on economic grounds before considering the environmental impact, which is added later in this chapter. There are only two areas of the country that receive less than four full hours of sunlight per day on average; the northwestern corner of Oregon and the western third of Washington state both lie within Zone 6, and most of Alaska receives as an annual average less than 3.5 insolation hours per day (see solar insolation map above). Most Zone 5 locations can achieve breakeven or better with solar PV, and 80% of the country that fall within Zones 1-4 can enjoy attractive financial returns.
It is worth repeating here that it is less expensive to add solar PV than not to add solar PV! Even more than being less expensive, it’s a good investment; if you were offered a guaranteed average annual return of 15% for the next 30 years, would you take it?
With such advantageous economic benefits, it is perplexing that solar power has not been further harnessed; as of July 2016, solar energy generated only “about 1% of the total electricity in the United States” (Kennedy, 2016). Fortunately, the reasons for this gap seem to be informational rather than philosophical. In a 2015 national survey, homeowners overwhelmingly identified solar as the most important energy source for America’s future (SolarCity, 2015), and 82% indicated “saving money” as the primary motivator influencing decisions about purchase of clean-energy products and services. Further, 64% said that “saving on monthly electric bills” would have the highest impact on their decision to install solar panels.
Most Americans seem sold on solar as an energy source, and want to save money on their electric bills, but they hold an inaccurate perception that solar energy costs more than utility-provided power. We believe there are two primary factors to help explain this. First, the cost of solar PV continues to fall steadily and significantly, making it challenging to keep abreast of present realities and trade-offs. Second, most of us lack an intuitive ability to calculate multi-year and compounding returns without the aid of computer tools (spreadsheet). A 2012 Harris interactive poll found that while 77% of homeowners reported they would install solar if costs were not a barrier, 97% overestimated the cost of solar; for many by a factor of 20 (Korosec, 2012). In a similar survey two years later “…70% of Americans perceived cost was a barrier to installing solar panels to their home to offset some of their electricity use” (Tuerff, 2014). A significant education and awareness effort is required to debunk the myths of solar cost and investment.
While “saving money” comes through as the primary motivating factor in considering solar for most Americans (82%), “reducing my environmental impact” ranked second most important at 34% (SolarCity, 2015). Asked independently, a majority (52%) of homeowners indicate that they consider environmental, social and governance (ESG) impacts of their choices and spending, and three-quarters (75%) indicated that ESG investments would be “compelling if they offered a potentially higher return” (SolarCity, 2015). Financial interests are primary for most Americans, but most also voice a significant level of concern for the environment and seem to recognize the need for a major shift from fossil fuels to renewable energy. Fortunately, residential solar today serves both interests.
The Right Price
Economists are concerned with getting the price right; that is, having the price of any good or service reflect its full costs. The right price is important to signal behavior in the market and account for costs that are not explicit in bringing the good to market. These hidden costs are referred to as externalities, and for fossil fuels it includes the environmental cost of extracting, refining, and using them; burning fossil fuels emits CO2, sulfur dioxide (SO2), nitrogen oxides (NOx), and other pollutants. While many high-income countries (HICs) in Europe have employed a national carbon tax to account for the environmental impacts (damage) of burning fossil fuels, the U.S. has thus far resisted this method of accounting. In addition to the price failing to reflect the full cost, thereby signalling optimal market behavior, consumers of fossil fuels today are pushing the external costs onto future generations, and this creates concerns of intergenerational equity and justice.
We can apply the cost of environmental externalities to grid-distributed electricity in the U.S. The Environmental Protection Agency (EPA) monitors energy mix portfolios for each regional power generator; these can be viewed at www.epa.gov/energy/power-profiler. Unitizing pollutants by source and using a cost of carbon of $80 per metric ton adds 3.96 cents ($0.0396) per kWh to the Virginia case highlighted earlier in this chapter. Electricity customers in that region are currently assessed about 10¢/kWh, but would be charged closer to 14¢/kWh if the environmental externality were internalized in the cost (with CO2e at $80/ton); this significantly changes the economics of renewable energy generally, and solar PV specifically. Note in the comparison below that the savings are roughly doubled when the environmental externality is added.
Location for 7.08 KW PV
Latitude and Insolation
Output/year Grid rate
Net cost and loan pmt.
Value elect. generated
Net benefit in first year
Less spent over 30 years
Invest savings at 4.5% rtn.
Invest savings at 10% rtn.
30-year ROI ann. avg. rtrn.
Rockingham, Virginia
without including environmental impact
38° North; Zone 4/5
8,677 kWh; $0.10/kWh
$12.390; $753/yr.
$900/yr. predicted
$146.66
$18,137
$30,024
$63,633
9.5%
Rockingham, Virginia
with including environmental impact
38° North; Zone 4/5
8,677 kWh; $0.14/kWh
$12.390; $753/yr.
$1,256/yr. predicted
$502.66
$34,251
$60,080
$137,820
13.6%
There have been many efforts to introduce a carbon tax in the U.S., and they often attract bipartisan support at the early stages, but politicians are reticent to be tagged in any tax-hike legislation, and this becomes notably difficult for a president adding the final signature. As of this writing, there is a new push from a large group of renowned economists, including 27 Nobel Laureates in economics, four former Chairs of the Federal Reserve, and 15 former Chairs of the Council of Economic Advisors. The program is designed to be revenue-neutral, returning the tax to households in a progressive dividend formula that advantages the poor, with the argument that they will be least able to cope with rising energy prices. Pieces of the proposal appeal to both liberals and conservatives in American politics, and while environmentalists would likely wish stronger action, this proposal would be a significant step toward their ultimate objectives. With the possibility of gaining bipartisan and environmental support, this is perhaps the best chance in years for legislating a carbon tax in the U.S.; that would make solar PV investments even more attractive than they are today without factoring externalities.
Though the federal tax credits on solar through the ITC program are currently set to decline after 2019, and cease altogether after 2021, there remains strong public support for renewable energy incentives. In a Pew Research Center survey last year, 89% of Americans favor support for expanding solar energy (Kennedy, 2016), and in a SolarCity (2015) survey, 74% of homeowners favor continuation of the federal tax incentives that promote its growth. It is unclear whether the ITC program, or its support, would continue if a carbon tax were to be implemented, but there will likely be strong political pressure to have one or the other in place over the long term. In either case, it is expected that the cost of solar PV will continue to decline, which should preserve the economic advantage even if the ITC fully sunsets on schedule under the current policy.
Personal Responsibility
Another way to view externalities from fossil fuels is through a lens of personal responsibility. Some take the approach that if their market and regulatory environments do not mandate full cost pricing for everyone, they take it upon themselves; this is easily done by self-assessing a “tax” on the fossil fuels they burn. Proceeds from such a tax could fund renewable energy or efficiency projects, or given to global neighbors who are most impacted by climate change, least complicit in having contributed to it, and least able to adapt due to lack of resources. A less activist approach, but still meaningful, is to add the externality to the price of grid-provided electricity; that makes clean energy investments, and especially solar PV, much more enticing by comparison.
Energy Loss
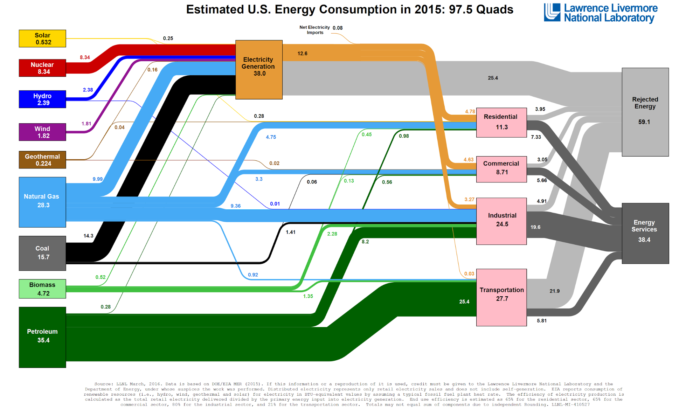
Another argument for home-generated solar energy is that large commercial production incurs significant losses in generation and distribution. The Lawrence Livermore National Laboratory (LLNL) tracks energy flows in the U.S. by source and consumption. The graphic below shows that 67% of generated electricity is rejected before it gets to the end user (LLNL, 2016), and since most energy for residential use is sourced from natural gas and coal, this waste represents a tremendous environmental cost against no benefit.
Commercial Solar
While commercial power production is inefficient and wasteful, it is still required to make distributed solar viable, at least until home battery development matures. The strongest critique of solar energy is that it is intermittent; this often results in surpluses during peak production periods (middle of the day), and insufficient output when household energy demand is greatest (mornings and evenings). Most electric utilities now offer net metering, which allows surpluses to flow back into the grid while crediting the homeowner’s account. The meter spins forward when the homeowner is demanding more energy than their PV system is providing, and it spins backward when the system is producing more energy than the homeowner is demanding. Reconciliation typically occurs monthly and the net demand (positive or negative) determined. Utilities have different policies on how surpluses are handled; most carry forward monthly surpluses, which then offset against monthly deficits later.
Heat Loss in Solar
While most of the rejected energy in the electricity stream comes from waste heat losses in the generation phase (Carrington, 2014), a full 5% of all electricity generated in the U.S. is lost in transmission and distribution (EIA, 2017). By contrast, most solar installations feed electric demand at the generation location or in close proximity, virtually eliminating transmission losses. Regarding waste heat, a portion of the sunlight that falls on solar panels is indeed lost as unusable heat, but precisely because some of the sunlight is converted to electricity and piped elsewhere for use, the heat that would have been absorbed by the roof surface now shaded by the solar panel is significantly reduced. On a net impact basis, solar PV produces very little waste heat in operation, and avoids transmission and distribution losses. The worst offender of rejected energy is in the transportation sector (refer to Figure 2.6); this will be addressed in the Energy Systems chapter with arguments for electric vehicles fed by solar PV.
Electric utilities are mandated to meet customer energy demands, which are variable, and this makes management of power generation or power purchase challenging. When small-scale distributed solar installations first enter a net-metered utility grid, this typically benefits the utility by contributing power into the grid during daytime hours when business and industry demand for electricity is highest. However, another common peak period for utilities serving residential areas are the evening hours when many homeowners reach their daily peak demand, and when solar production is low or none. In addition to revenue losses by customers generating their own energy (either in part or whole), electric utilities also worry about confronting even greater variability of demand if distributed solar production reaches critical thresholds. For example, if a large percentage of customers in a given utility produced net 100% of their energy through a net-metered system, the utility could run into global surpluses during peak solar periods, and then have enormous demand during evening hours; this would not only be difficult to manage, but it would be more expensive operationally, per kWh.
The business model for electric utilities must be concerned about the cost, maintenance, and investment recovery of their generation and distribution infrastructure, including production facilities, cables, transformers, meters, and other services. Many utilities charge a base-level fee, or standby charge, to work at fairly assessing solar producers who benefit from being connected to the grid. For all these reasons and more, many electric utilities have not warmly embraced distributed solar PV. Desperately needed is a strategic vision and plan for the future, and supportive public policy that directs the country toward sustainable energy while assisting utilities as they manage the transition.
Commercial-scale battery storage is viable for some applications, and prices continue to fall while performance and durability both improve. One potential path forward is the gradual phase-in of neighborhood-level energy storage, with emergency backup from regional utilities. Unfortunately progress toward new paradigms will be slow, without policy and political pressure, due to the legacy systems and stranded investment in old technologies.
Home battery systems, coupled with solar PV, have matured dramatically in the past few years. Tesla recently introduced its second generation (14kWh) Powerwall for $5,500 (Tesla, 2017); it is difficult to justify this purchase on economic grounds for homes connected to the grid, but sales are brisk for off-grid applications, and where grid energy is less reliable. Tesla, LG Chem, and other battery manufacturers are competing, innovating, and improving their products at an impressive pace. If utilities make it difficult or costly for homeowners to install solar with net metering, home battery for off-grid operation will become commonplace, even in grid-covered areas. One promising collective arrangement would utilize distributed solar PV with smaller home batteries, but connected to larger neighborhood-level commercial storage, with emergency backup from regional grids. Another solution gaining traction is to couple electric vehicles (EVs) with home solar and battery systems that allow the EV to feed the home network during emergencies or lengthy low production periods. Tesla, with its vertically-integrated strategy, already has all the pieces to make this possible at scale. Planning for a future of home-installed solar PV with battery storage will ideally include a south-oriented roof at a pitch close to local latitude to minimize low-production months when the combined systems may not keep pace with demand.
Planning for Solar
Fortunately, investing in onsite solar PV is not more costly and does not require financial compromise. Most Americans will find solar PV to be financially lucrative; this also may allow for less expensive and less environmentally-damaging design and construction. Top priority for homeowners, builders and architects should be to design and orient a new home, for solar capture to meet at least 100% (net) of the expected energy demand of the home; here are the initial planning steps:
- Plan for all energy demand in the home to be electricity-based (eliminate direct uses of fossil fuels, such as for gas cooking or drying, and gas or oil heating).
- Consult history of electricity invoices (over several years, if possible) to determine expected annual household demand.
- If some household energy has come from fossil fuels, that needs to be converted to electricity equivalent and added to expected annual electricity needs/demand.
- Navigate to www.pvwatts.gov to size the solar PV system needed to meet demand, specific to your locality.
- Start by adding your location by address or zip code; select the nearest weather data location and go to the next page (right arrow).
- On the System Info page, start with 10 in the DC System Size (kW). The average American household used 10,812 kWh in 2015; 10 kW will get close to that.
- Unless you plan for extraordinary equipment, leave the next three boxes (Module Type, Array Type, and System Losses) with the default answers.
- Input the Tilt (deg.) associated with the installation. Optimal tilt is close to local latitude, though local weather conditions have influence.
- Input the Azimuth (deg.) associated with the installation. Optimal azimuth is often at true south (180°), though local weather conditions have influence.
- Go to PVWatts Results (right arrow). This will show expected output, by month and year (this is the number that corresponds to your electric utility invoices in kWh).
- Use the left arrow to return to System Info page to try different numbers in the three fields (size, tilt, and azimuth). If designing, try to find optimal output.
- The DC system size can then be shopped with solar wholesalers or solar installers. Multiplying the watt rating for each panel, times the number of panels, provides the total system size in DC units.
There are a few important options in selecting a solar PV system. If the job is bid to a certified dealer and installer (contractor), it’s likely that entity will make many of these decisions on their own, or they may offer some packages with a few different combinations. If the homeowner sources equipment from a solar supply center, they will do well to investigate these choices; here are the primary issues involved:
An area of solar PV technology to watch in the future is integrated solar roof shingles. This concept is not new, but more recent developments and prototypes from Tesla look promising. Early efforts at this new concept are likely to be more expensive, initially, than standalone modules, but we believe it is promising enough to influence roofing choices, a topic we return to in later chapters.
- A certified dealer/installer will take care of many of the little details involved in a solar purchase and installation, and that will be built into their pricing scheme. Homeowners can save more than a dollar/watt by taking on some of these tasks, while also learning more about options and choices. Many solar supply centers (e.g., wholesalesolar.com, civicsolar.com) offer complete packaged systems, including panels, roof racking, and inverter system; some will also provide battery backup systems. Online and phone support is available to help the homeowner navigate selections and make the direct purchase. The homeowner may wish to do the installation, or contract with an electrician or solar installer; installation contracts often use one dollar/watt as a starting point for negotiation.
- Solar panels (modules) come in different sizes, both in physical and production rating. There are two common physical sizes, called 60-cell and 72-cell. Larger modules produce more energy than a 60-cell unit of the same brand, model, and cell-type. Since most configuration and racking systems are the same for these two standard sizes, racking costs as a percentage of the total can usually be reduced by selecting the larger module; this cannot be assured if comparing across brand, model, or cell-type. The 72-cell modules are heavier and therefore a little more difficult to hoist, place, and fix, but in most cases an array of 72-cell modules will be less expensive than using 60-cell units.
- The two most common solar technologies are polycrystalline and monocrystalline modules, with the primary practical difference being power density. Monocrystalline modules produce more energy for the same surface area as polycrystalline, which makes them the best choice where mounting space is limited. If appearance of the panel surface is important, that could also factor into this decision; monocrystalline modules are more uniform and darker in color. If space and appearance are not factors, polycrystalline modules will in most cases be less expensive than monocrystalline.
- Solar PV produces direct current (DC) energy, and since most uses in the home require alternating current (AC), the energy needs to be inverted. There are several Inverter systems; the most common and least expensive is usually the string inverter. This brings the power of a string (think of a row) of modules aggregated together into an inverter that may receive signal from multiple strings. Cost is the main advantage; disadvantages are that individual modules cannot be monitored, and energy from each module is limited to the lowest-producing panel in the string. Microinverters work at the module level, and invert the energy at the panel so that energy flows from the array in AC; this allows individual monitoring and performance on a per module basis. A more recent development is DC optimizers that work at the module level, taking advantage of per-module monitoring and performance, while also inverting the signal from DC to AC at a central inverter location. Current battery technology stores energy in DC, suggesting that microinverters are not the best choice if battery backup is planned or provisioned for possible future installation.
Case Study
Sizing a solar PV system for an existing home is straightforward because the homeowner has historical data on energy use and what is needed to fully offset their demand. Sizing solar PV for a new residence is more challenging, since energy required to condition a new house cannot be known with certainty before gathering actual lived data; this was the situation of the case project. The homeowner had been living for several years in a relatively new house, and using about 9,000 kWhs annually, but that home had a code-minimum building envelope. The case study home was designed to have a much more robust building envelope, which should have reduced heat loss and energy costs for conditioning space. However, the very tight envelope required mechanical fresh air exchange; that was achieved with an energy recovery ventilator (ERV), which the previous home did not have. An additional uncertainty for the case study is electric vehicle (EV) charging. While the homeowner had been charging an EV for the past four years, it had a relatively small battery size of 7.6 kWh, and the plan was to eventually do all vehicle travel on electric, likely with a vehicle battery size of 50 kWh or larger. All of these variances were considered in calculating a predicted annual energy need for the household.
When designing a new house, the size and shape of the roof should be considered in light of module size and configuration, in addition to optimizing pitch and azimuth. With modules set in portrait orientation, the case study roof was wide enough to accommodate eight panels across the width (either 60-cell or 72-cell modules), while still allowing minimum setbacks from roof edges. Since the homeowner wanted a perfect geometric shape (rectangle) of the full array, this required panels in increments (or rows) of eight (8, 16, 24, or 32); this then becomes a matter of selecting modules by power output, in one of these increments that total the desire power production (number of modules times energy production rating). With the case house, we settled on 24 monocrystalline modules at 300 watts/each for total DC systems size of 7.2 KW. That array in its unique location, pitch, and azimuth is predicted to produce 9,729 kWhs annually, roughly 8% more than the 9,000 kWhs demanded annually in the code-minimum house the family was moving from. This was our best estimate of need, given a more robust envelope, but with more EV charging for transportation.
Inverter systems are also made in block increments, and in this case we opted for a 7.6 KW inverter with DC power optimizers. The inverter sized slightly larger than the rated production of the array allows the option to add modules later, if necessary to meet larger-than-predicted energy demand. The central inverter with DC power optimizers were selected to provide per-module production and monitoring, and to be ready for adding battery backup in the future, should that ever become necessary or economically viable.
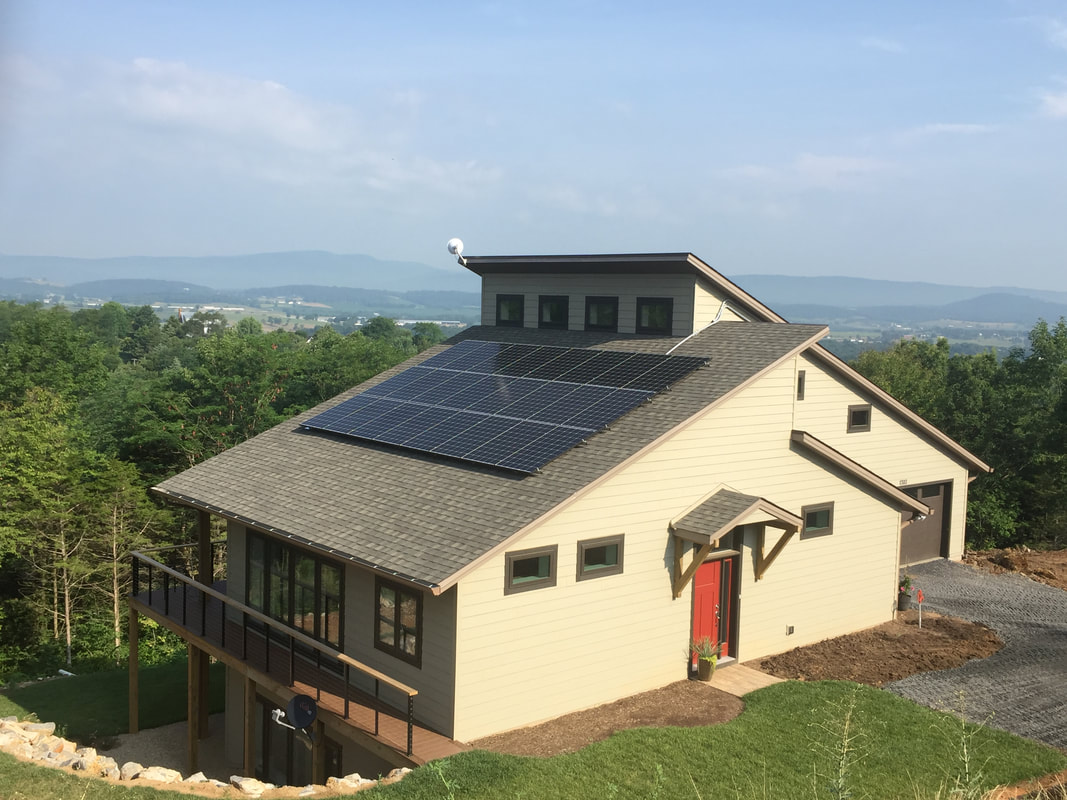
The homeowner solicited bids for the solar project from several local installers. He then researched prices and products purchased directly from solar supply centers. One entity that presents complete solar PV packages well is Wholesale Solar in Mt. Shasta, California (https://www.wholesalesolar.com/). However, their location on the U.S. west coast makes shipping cost-prohibitive to east coast locations. Civic Solar (https://www.civicsolar.com/) is one of the larger solar supply centers servicing the east coast and southern states. Several other suppliers were reviewed, but in the end the homeowner purchased the complete system from Civic Solar at $1.21/watt, and contracted with an installer to do the installation for $1.00/watt (for a total installed cost of $2.21/watt). Civic Solar, and some other suppliers do not list fully packages systems on their website, but their customer service agents work with clients and are happy to quote complete systems. The image to the right shows the installed array on the case study roof
Conclusions
In almost every area of the United States, solar PV is not only adequate as a clean energy source to power American homes, but it is also a good financial investment, and it provides the mechanism for individual housing units to achieve operational sustainability. While the sun’s energy is more than adequate to provide all household energy, the intermittency requires electric utilities to provision net metering, at least until battery backup technologies and costs improve. The heavy upfront investment cost for solar PV has acted as a barrier to widespread adoption, but declining overall costs, and a better understanding of how to value a lengthy period of energy benefits, should reduce or eliminate this concern. Solar PV makes sense from an economic and financial perspective, and when environmental externalities are added to the energy delivered from most utilities, the economic advantage improves still further. Monetizing the environmental damage is significant in assigning the full cost in the marketplace, which strongly influences a turn away from degrading fossil fuels in favor of clean renewables.
Subsequent chapters will analyze the economic and ecological implications of other choices in the home building process, but onsite self-produced solar PV is at the heart of achieving sustainable housing, and it changes the calculus for so many other building and outfitting decisions. If solar PV is available (SOAR), onsite and with utility net metering, homeowners should design for enough solar production to meet 100% of expected energy needs, and then choices about other energy elements can be made on the basis of financial return, personal comfort, or preferences. If solar PV is limited (SORTA), either by space or utility constraints, homeowners should design to maximize solar production within that limit, then design the rest of the house to attempt to bring energy demand down to that annual production level. However, as we show in Chapter 5, there are few responsible and recommended upgrades. If solar PV is unavailable (SNAIL), homeowners cannot take advantage of the economic and ecological benefits of onsite solar PV. If designing a new home for such a scenario, the most responsible choice would be to limit the size, scope, and footprint of the residence, and select the few recommended envelope upgrade elements to minimize energy use. Homeowners who would wish to install solar PV, but discover that it is not possible on their house, can offer to place a system on a neighborhood property; perhaps a church, nonprofit organization, or business. This is called an offset, and in this case it refers to the homeowner offsetting their household energy by providing an equal or greater infusion of clean energy at some other place on the electric grid. Where public policy or regulation prohibits or limits household-level solar installations, many voices will be needed in advocacy to influence systems and pry them loose from entrenched fossil fuel interests.
Do’s
-Prioritize solar PV for any project (new construction, renovation, or simple add-on)
-Design and orient new house for optimal solar PV production (and maybe passive)
-Plan for all energy needs to be electricity-based (eliminate direct fossil fuel use)
-Size PV system to meet at least 100% of home energy needs (on annual basis)
-Make provision for battery storage integration later, even if not initially planned
-Consider pitch of array related to potential future battery and off-grid capability
Don’t’s
-Don’t allow upgrades in other areas of the house to limit solar PV at 100%+ needs
-Don’t be dissuaded by upfront costs of solar PV; in most areas of the U.S. it is cheaper to install solar than not to install solar because the initial cost is offset by an annual stream of energy benefits, and this includes cost of funds and expected energy inflation.
-Don’t be afraid to research and purchase a complete solar PV system, including modules, inverter(s), and racking. The homeowner could then use self-installation, or contract with a certified installer for around $1/watt.
Check back for links to buy the book here!