Table of Contents

  1. Introduction
  2. Where does the Energy Go?
  3. Electricity as Sole Source of Energy
  4. HVAC Systems
  5. Geothermal Heating and Cooling
  6. Mechanical Ventilation (Energy Use)
  7. Water Heating
  8. Lighting
  9. Appliances
  10. Electronics
  11. Solar: Active and Passive
  12. Battery Storage
  13. Electric Vehicles
  14. Case Study
  15. Conclusions
    1. Do’s and Don’ts
    2. Other Pages

Opening Questions

-What energy sources are commonly used to power American homes?
-Why should homes be planned with electricity as the sole energy source?
-How do the surprising findings of this study inform HVAC systems/choices?
-What are the energy/air quality cost-benefit trade-offs of mechanical ventilation?
-What methods/tools are available to reduce the cost and energy of heating water?
-How do aesthetics & financial return inform lighting technology & systems selection?
-How to evaluate/select appliances on the basis of energy efficiency and financial return?
-How do solar systems (passive and PV) work with the mix of energy need/use in the home?
-What are the arguments for and against battery storage, and/or grid-tied/off-grid systems?
-What are the implications and opportunities for integrating EV charging in home energy?

Introduction

Energy is one of the most prominent connecting webs of modern society. Not only does the energy grid connect nearly every physical and functional space in our lives, but the way we use energy has implications for every other living organism on earth, both in the present and across generations. The wise counsel of Chief Seattle (chapter opening quote) reminds us of our small but significant place in the overall web of life and of our capacity to do harm to ourselves and others if we do not care for its life-giving endowments. Is the modern life that Americans have grown accustomed to compatible with protecting and preserving the overall web of life? A review of how we use energy will help answer that question and then inform choices about new directions and paradigms in household energy and transportation systems.

Where does the Energy Go?

Electricity flows seamlessly to a large number and variety of household gadgets and equipment, yet without individual metering, it is impossible to understand home energy uses and systems with much precision. That uncertainty or ignorance makes it difficult for homeowners to take steps toward strategic energy reduction, as well as to make informed choices about new purchases on the basis of energy efficiency, environmental impact, and financial return. This chapter explores many of these questions, offers recommendations on some specific choices, and provides tools for homeowners as they navigate the broader landscape of residential energy management.

The energy information that homeowners know very well is the amount they pay in utility bills, monthly and annually. In the previous chapter, we referenced Department of Energy data on total U.S. residential energy consumption, averaging $1,945 annually per household from all energy uses (DOE, 2018a), and 48% for HVAC (DOE, 2018b). Roughly confirming that data independently, Lawrence Berkeley National Laboratory (LBNL) estimated the figures at $2,060 and 42%, respectively in 2013. Those data points were critical in the previous two chapters in assessing thermal envelope systems, but the LBNL data also provides estimates of the entire household by functional classification, and that will guide the organization of this chapter. The LBNL pie chart below illustrates the typical American household distribution of energy uses across six categories; we will analyze each wedge (combining heating and cooling into HVAC) to provide guidance and recommendations on energy management..

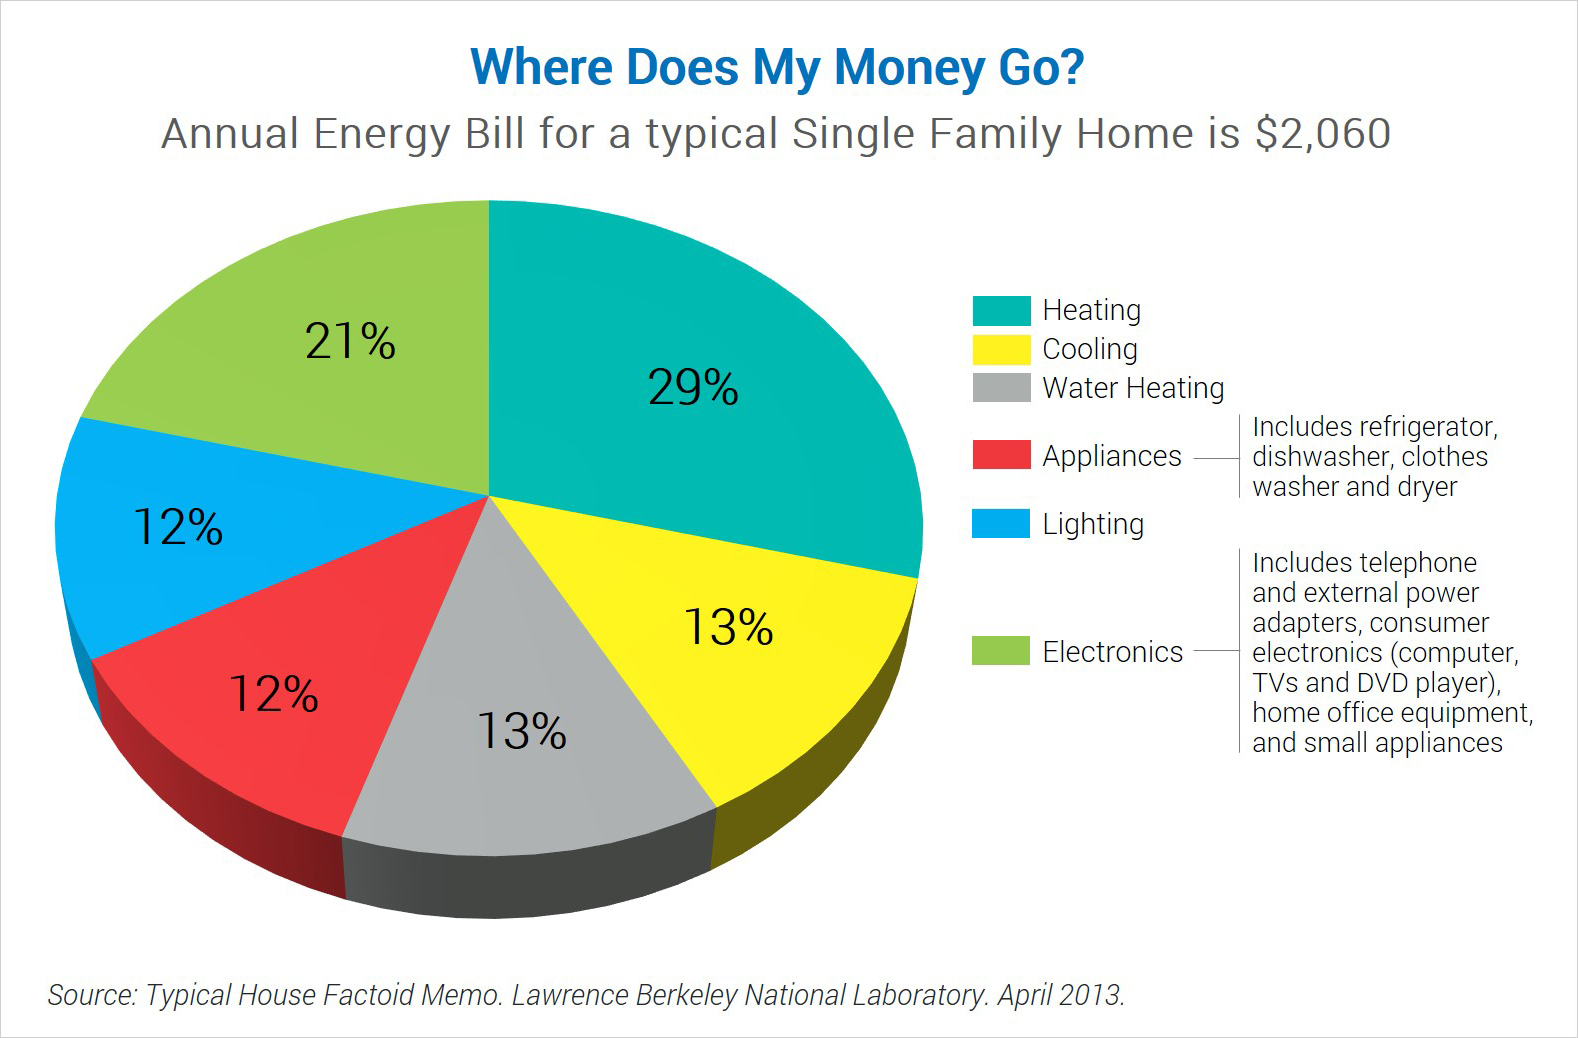
Electricity as the Sole Source of Energy

Before venturing into each energy area, it is important to reaffirm our appeal to migrate toward electricity as a sole energy medium. Most U.S. homes today utilize electricity as the primary energy source, but many still also use direct fossil fuels for heating uses; possibly for indoor air, hot water, clothes drying, and cooking. Regardless of whether the energy is derived from natural gas or liquid propane (LP), fuel oil, kerosene, or coal, once those hydrocarbons are burned, their pollutants are released into the air and cannot be retrieved. While the pollutants eventually decay in the atmosphere, they exert damage over a lengthy period, and humans are emitting fossil fuel pollutants in quantities that nature cannot safely absorb and transform. The pace of fossil fuel extraction and use threatens the web of life, compromising health locally and unbalancing the climate globally (see chapter 2 and Appendix A).

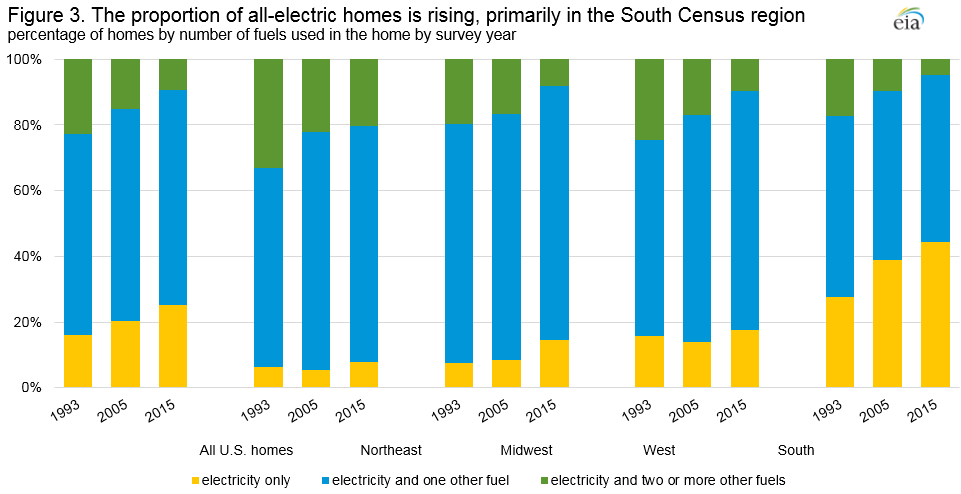
While electricity is still generated with a mix of fossil fuels in every utility region of the U.S., the percentage of hydrocarbons in the overall energy portfolio is on a downward trajectory. In 2018 the energy mix for electricity generation nationally included 30.4% from coal, 33.8% from gas, and 0.6% from oil, for a total of 64.8% from fossil fuel sources. Where residential energy is sourced from a local utility grid, replacing an appliance that runs on a fossil fuel (100%) with an electricity-powered equivalent (64.8%) immediately reduces pollutants from hydrocarbon fuels. The better option, of course, is producing clean(er) energy on site through solar PV, which we argue in Chapter 3 provides an attractive return on investment anyway in nearly every region of the country. Clean and renewable energies have only recently fallen in price to be economically competitive with fossil fuels at household scale. The cost of commercial scale solar fell below fossil fuel sources several years earlier, and analysts expect the trend of falling prices on solar PV to continue. The figure below shows electric-only homes increasing as a percentage in every region of the U.S. since 1993. To speed this transition, we strongly recommend that no new homes be planned with any fossil fuel energy sources or direct-use appliances, and that existing homes shift to electric models when appliances need replaced.

HVAC Systems

This section will integrate systems for heating, cooling, and ventilation for air flow and indoor air quality. in the previous chapter we noted that almost every inhabited U.S. home will suffer from impairment levels of CO2 unless indoor air is exhausted and exchanged with fresh air and distributed effectively throughout the residence. CO2 levels rise rapidly in enclosed areas where people (and possibly pets) respirate, and the most susceptible spaces are bedrooms, where occupants spend the most concentrated time, and often behind closed doors. This points to the need for ducted HVAC systems to distribute air evenly to all livable spaces in the home. Ideally, each individual room would also have an adequately sized return air vent for effective distribution of fresh air when a ducted system is combined with mechanical ventilation (ERV or HRV). An accommodation is possible for ERVs with ducted systems and central returns, but that requires more energy and operational use of the blower fan; this will be address in the mechanical ventilation section below. Ducted systems that move air through all livable spaces also provide deterrence against indoor moisture build-up and possible mold growth.


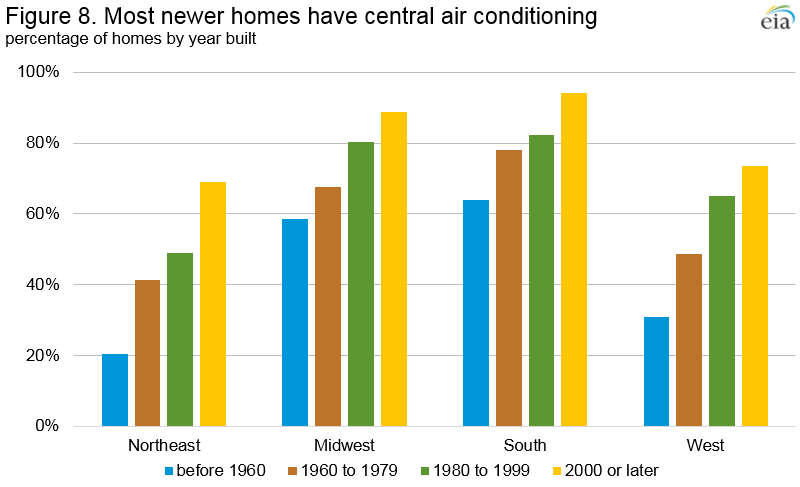
With the two recommendations of electric-only equipment (to eliminate or minimize fossil fuel pollutants) and ducted distribution (to avoid unhealthy CO2 levels and moisture/mold problems), the range of choices for HVAC narrow to forced-air systems, or central heat pumps. There are many other heating and cooling systems, but because they do not meet the dual criteria noted above, we will limit our analysis to the family of central heat pump options. Fortunately, heat pumps are among the most cost-effective and energy-efficient choices and provide strong cost-benefit value. They also offer both heating and air conditioning (the cooling feature adds minimal cost to the base heating-only unit), and they dehumidify indoor air which, in addition to improving comfort, offers further protection against the potential for moisture and mold problems. The following graphs show that a large and growing percentage of U.S. homes are already equipped with central ducted systems; however, a great transition is needed toward electric heat pumps.


There are three broad types of heat pumps; air-sourced, water-sourced, and ground-sourced.  While heat pumps can be found in a variety of efficiency levels (efficienciency also varies by source temperature), the U.S. Department of Energy (2018) uses an overall estimate to suggest that heat pumps use only about half of the energy for equivalent heat production compared with electric resistance heating. Electric resistance heat is often used as a baseline for comparison, and the 50% reduction in energy use and cost from heat pump technology is significant.


Air-source heat pumps are the least expensive of the three types, but their source (air) fluctuates with greater extremes than the other two systems, and that makes them less efficient at the extremes. If outdoor air temperatures fall too low, an air-source heat pump may not be able to deliver enough heat to meet demand. To compensate for these potential limits, heat pumps sold in cold climates are equipped with supplemental heat, which is often electric resistance coils mounted above the blower fan. Even though heating at such cold extremes may tap into the less efficient auxiliary heat source, the frequency and duration of supplemental heat needs are minimal in most U.S. regions, and the year-around energy profile is accounted for in the DOE estimate of 50% overall energy reduction.


Geothermal (water or ground-source) heat pumps extract heat from sources that rarely fall below freezing; that limits operation at the most inefficient temperature ranges and largely avoids the need for supplemental heat. That reality makes water and ground-source units more energy-efficient than air-source heat pumps overall, but the additional cost to extend heat extraction to those sources is significant. A water-source heat pump may harvest water from a river, lake, spring, or well, and a ground-source system will require extensive piping in horizontal or vertical underground loops. The piping itself is not cost-prohibited, but the drilling or trenching required to install the pipe loops below the frost line can run into tens of thousands of dollars.


Heat pumps are quantified with many different ratings, including SEER (Seasonal Energy Efficiency Ratio), HSPF (Heating Seasonal Performance Factor), EER (Energy Efficiency Ratio), and COP (Coefficient of Performance), among others. There are good resources online to explain all of this complexity, but we think a few broad recommendations can simplify and be helpful for homeowners. From an aesthetic perspective, geothermal heat pumps are preferable because there is no outdoor equipment; anyone who has encountered an outdoor heat pump can attest to the noise and commotion they make as they move air with great force and significant noise. However, geothermal systems are almost always much more expensive to install, and if an air-source outdoor unit can be placed in an out-of-the-way place, aesthetic concerns diminish.


If the installation location is in a climate that encounters frequent and long durations below 10℉, a geothermal system may offer a reasonable payback on the initial investment. The lack of specificity here reflects the wide range of variance and possibilities, from climate, to geo-source development, to user expectations and behaviors. The U.S. federal government offers a tax credit of up to 30% of the installed cost of a geothermal heat pump system. This is significant assistance, if homeowners qualify for the full credit (they must have tax liability), but even at that discounted net price, the cost premium for a geothermal system may never be recovered in lower energy bills. The case house offers a helpful control study on energy and cost returns by heat pump system and is discussed below and throughout the chapter. Further, when we apply the tools of finance to heat pump options, as we did with the thermal envelope, there is little room to find breakeven return on investment for upgraded systems.


The chart below shows return on investment (ROI) for four possible scenarios in upgrading HVAC systems or equipment. The time period for the financial analysis is 20 years, which is the expected average lifespan for HVAC equipment, and the cost of funds (COF) rate of 4.5% is used since many homeowners finance home improvements with a mortgage, simple bank loan, or a home equity line of credit (HELOC). 4.5% is realistic in 2018 at the time of this writing, but is low and conservative by historical record, and rates higher than 4.5% even further diminish ROI.


20-year analysis, considered for upgrades in HVAC system/equip.

Annual dollar savings (and % of HVAC cost) from reduced energy use and bills expected from an upgrade in HVAC system/equipment

Maximum cost (investment) in HVAC upgrade to achieve the respective annual savings and simply break even in 20 years

$47 (5% of avg. HVAC cost)

$725

$93 (10% of avg. HVAC cost)

$1,450

$234 (25% of avg. HVAC cost)

$3,600

$467 (50% of avg. HVAC cost)

$7,200

Financial Model Assumptions (no inclusion of environmental cost of energy production):

  1. Average annual American household cost of energy for HVAC operations ($934)

  2. Cost of funds: 4.5%, proxy rate mortgage loan (higher COFs = lower max. cost)

  3. Rate of energy inflation 3.0%: conservative annual escalator, given historical trends

  4. 20-year period for break-even ROI: expected average life of heat pump systems

  5. Payback calculator hosted at: http://18.213.234.181/housing 


As an example to explain the scenarios on the chart above, if an upgraded SEER on an air-source heat pump could successfully cut 5% ($47 annually) off HVAC energy costs, the most that should be spent for the upgrade over the base 13 SEER unit is $725. At current cost escalation rates for higher SEER ratings, and the somewhat dubious claims of energy efficiency gains, our team is skeptical that any upgrades make sense on a financial returns basis. Some geothermal upgrades over an air-source heat pump may yield some energy savings, but the premiums required for those systems–even with the federal tax credit–will in most cases be well beyond maximum upcharge thresholds.


Given our criteria that the HVAC system should be ducted and electric only, the baseline HVAC system is the most basic central, air-source heat pump, rated at 13 SEER. Heat pumps can be purchased with SEER ratings as high as 27.5 (Consumer Reports, 2018), but at increasing price premiums with each upgrade. Our analyses and experiences across many installations leave our team with significant doubt that higher SEER ratings in air-source heat pumps can meet any of the cost-benefit thresholds to make an upgrade worth selecting.


The analysis above is strictly financial; that is with intention, but it requires more explanation. We made the case in Chapter 3 that onsite solar PV is not only financially viable, but an attractive investment in nearly every region of the U.S. We further argued that the ratio of embodied energy in material and scale to operational energy savings is far superior in solar PV systems than for thermal envelope upgrades, and the same applies here to HVAC system upgrades. In other words, scaling up a solar PV system provides far more operational energy benefits than embodied energy costs than upgrading the HVAC system, especially from an air-source heat pump to geothermal. Therefore, it is much better from a whole systems ecological view to couple a basic air-source heat pump with a slightly larger PV system, than to upgrade HVAC equipment for the sake of installing a smaller solar PV system.


Financial analysis pointing to the most basic unit will become a theme for this chapter, and in many ways it grinds against intuition, conventional thinking, and the orthodoxy of the building industry. If a home can be fitted with enough solar PV to produce 100% of the energy demanded by the household, the best choice for other systems is almost always the most basic and least-costly option (one notable exception is lighting, explained later in this chapter). The most basic and least-costly option is less damaging to the environment because, while it may use more operational energy, the solar energy demanded is clean and renewable, and the embodied energy in the solar PV system is less harmful than the embodied energy in most equipment upgrades (except lighting) at the margin, scaling up. Many basic and least-costly options are also more reliable and less prone to breakdown and repair because they have less complexity and fewer parts; many also have expected longer life for these same reasons, and that offers the best scenario at end of life for recycling or waste (to landfill).


Basic and least-costly equipment options are also the best financial choice (most often) on a whole-house, whole-life basis. Purchasing upgrades to many or all of the systems in a home can quickly escalate into the tens of thousands of dollars. Applying the concept of opportunity costs, that level of investment would likely cover the full net cost of an entire solar PV system to not only power the basic equipment, but whole household energy demand as well, and perhaps even EV charging. Or, that investment could be used to transition to electric vehicle transportation which, if powered by onsite solar PV, would remove another sizeable portion from the ecological footprint.


Geothermal Heating and Cooling

Now consider geothermal systems, with even higher initial cost premiums than upgrading SEER ratings or other features of an air-source heat pump. Geothermal systems require extensive exterior piping, installed in excavated horizontal trenches or vertically drilled wells. Even if it were possible for a geothermal heat pump to use half the energy of an air-sourced baseline unit, the largest cost premium for the upgrade to break even over 20 years is $7,200 (scenario #4 above). The experiences of this research team across many projects in one region of the country, suggest that the development costs for exterior work alone will far exceed the $7,200 threshold. Secondly, data collected from real household experiences suggest that geothermal heat pumps will not come anywhere close to offering 50% savings in energy use and cost, compared with a base air-source heat pump. 


The lure of geothermal is the more constant and moderated temperatures a few feet below the Earth’s surface. This varies somewhat by latitude and local weather, but subsurface temperatures in the continental U.S. range between 50-55℉. The enticing theory is that heating indoor air from 50-55℉ uses less energy, and is therefore less costly, than extracting heat from outdoor air, which can fall well below freezing. During cooling season the geothermal system should theoretically claim even greater efficiency over the air-source heat pump, but such claims would assume that underground temperatures remain moderate even while extracting or injecting heat through the geothermal process. Our team found it difficult to locate data on the impact of geo loops on loop bed temperatures, and how quickly (or slowly) the earth returns to ambient 50-55℉ after having heat removed from–or transfered to–the ground surrounding the loops. To answer this question with the case project, we embedded temperature probes near the horizontal geo loops at three depths, 10, 6, and 4-feet below the surface. The results were surprising, given the hype and marketing of geothermal systems, but not at all surprising when compared against real energy data from households with installed systems.


As the case home began its first heating season, loop bed temperatures fell immediately onto consistent trend lines, even while short-term and low-level variability/recovery was evident in the readings. Predictably, the deeper probes registered highest temperatures, but even the 10-foot deep loop beds eventually fell below 40℉. The 6-foot deep probes bottomed out at around 34℉ in mid-February, and the 4-foot probes fell below freezing. Loop bed temperatures were logged every six hours, permitting real-time comparison with outdoor temperatures and indoor demand for conditioning. This made it simple to note instances when the geothermal system was advantageous and disadvantageous to a comparable air-source heat pump. There were many nights when outdoor air temperatures fell below freezing, while loop bed temperatures held steady in the 30s; however, there were also many occasions when outdoor air temperatures were warmer than the loop beds, and in those cases the air-source heat pump would have run at greater efficiency to heat the home.


Many geothermal advocates advance notions that subsurface temperatures resist significant movement from the operation of geothermal heat pumps, and that the ground or water source will quickly recover to its ambient norm. We found neither of these assumptions true for the case home, and temperature readings were logged from strategically-placed probes in the clay soil beds around the geothermal loops. The following chart displays the logged readings from those underground probes, effectively measuring the temperature of the ground from which the geothermal system would extract or inject heat. T1 and T4 stand out among the rest; those are the only two probes at the greatest depth of ten feet.


It is clearly evident that temperatures of subsurface soils (clay) at the case house are highly influenced by geothermal operations, and that recovery toward the mean during short-term non-operation is so slow as to be barely perceptible. Loop bed temperatures were still below 50℉ when cooling season began, even with more than six weeks of nonuse between seasons. As soon as cooling began, temperatures in the loop beds rose rapidly and steadily, as can be seen in the chart above. All of the probes, regardless of depth, topped out over 80℉, and the shallowest (4-foot) probes exceeded 87℉. More in-depth data on loop bed and ambient air temperatures is provided in the full-length volume adds to arguments against geothermal HVAC systems.


Overall energy consumption and comparison from the case and control homes (detailed in Chapter 6) confirmed what this temperature data would suggest; that the case home with geothermal used more energy (even with a premium thermal envelope) than the control house with a base 13-SEER air-source heat pump. Harvesting the Earth’s temperature for heating and cooling will be more efficient at greater depths, as the deepest probes in the case home also indicate, but that requires increasing development costs. The only way to consistently achieve the theoretical benefit of geothermal is to tap into deep underground water sources, either by exploiting a fresh water spring or drilling vertical wells; these would also need to be open-loop systems. Having a spring in close proximity to a house is rare, and drilling wells is the most expensive installation option which can add more than $20,000 to the project; again, this is more than net initial cost for a solar PV system to power the whole household.


Geothermal heat pumps are also pitched on the prospect of heating water, when equipped with a desuperheater. This process makes use of waste heat from the refrigeration cycle, which can be harvested with a heat exchanger and looped with the domestic hot water tank. Since this process can assist in hot water production, it should save energy on the independent operation of the water heater. Monitoring of case home systems confirms hot water assistance from the desuperheater, though we were not able to measure that benefit in exact energy savings. The fact that the case home used more overall energy than the control house, with a premium thermal envelope and desuperheater hot water assistance, suggests that the geothermal system (overall, with desuperheater operation) likely used more energy than the control house base heat pump without hot water assist. Actual overall energy use in other homes in the same region also suggest little to no overall energy savings from geothermal systems.


There are so many factors that can vary the overall energy use and efficiency of geothermal systems, including the geology endowments of loop beds (earth or water) to resist impact from the heat transfer process, and natural recovery rates. The relative difference between outdoor air temperature and geo loop sources also has impact on relative energy use by system type. It is not important here to determine which system is more efficient; rather, we posit that geothermal systems are not likely to return sufficient energy savings (if any at all) over an anticipated lifetime to warrant the premium cost at installation. That assessment is strictly a financial return on investment proposition, which turns still more problematic on review of environmental impacts. The embodied energy to develop the loop beds, either by trenching or drilling, is an enormous additional environmental cost of a geothermal system.


Be very careful of energy efficiency and energy savings claims for geothermal heat pumps, many of which compare their systems to worst-case electric resistance heat to make the geothermal case appear impressive. Even when compared with air-source heat pumps, the numbers are often theoretical or lab-based and assume rapid temperature recovery from loop beds. Our assessment, while limited by number of cases in only one region of the U.S., is based on actual installed operations. If homeowners and builders obtain HVAC bids for both geothermal and a base air-source heat pump, they can use the break-even analysis chart above, along with energy use claims, to assess the value of the competitive bids. Furthermore, if the home also includes solar PV (see Chapter 3), economic cost-benefit (ROI) becomes more important than energy efficiency from equipment upgrades, most of which incur more embodied energy. In short, we find no compelling evidence or reason to upgrade from air-source heat pump to geothermal, even if homeowners qualify for the full 30% federal tax credit, which is scheduled phase-out in a few years.


Mechanical Ventilation (Energy Use)

In the previous chapter we argued that indoor carbon dioxide (CO2) concentrations in most homes rise to levels that cause cognitive impairment unless there are systems or practices for effective air exchange. There have also been health concerns about volatile organic compounds (VOCs), but those have diminished more recently with reduced levels in building materials and better information about duration of concern after new construction. In this chapter we explore the energy impact of utilizing mechanical ventilation to address these concerns; then we explore a few alternative solutions. 


The energy recovery ventilator (ERV) is the most common equipment employed in the U.S. for residential air exchange. These are sized according to the volume of indoor air space, meaning that larger homes require larger equipment that is more costly at installation, both in dollars and embodied energy, and more costly to operate, both in energy demand and electric bills. Since there is variation by size and operational practice, we will use the example of the case house to illustrate the energy implications of mechanical ventilation in a mid-sized American home.


The ERV selected for the case house was Honeywell VTN5150E, with a dual-speed fan capable of moving 200 cubic feet per minute (CFM). The sizing was calculated by the industry standard of ventilating “the whole house at a minimum of 0.35 air changes per hour” (Indoor Air Quality, 2018). The system was designed to exhaust indoor air from the three bathrooms, thereby replacing individual bath fans and recovering some of the heat that independent fans would lose entirely; it also reduces penetrations through the thermal envelope from three to one. Even though the one central exhaust penetration is larger than individual bath fan vents, the most compromise from thermal envelope penetrations is leakage at the junction between materials, and this is handled once with one central exhaust point.


ERV manufacturers (Honeywell in this case) specify supply of fresh air from the unit to indoor living spaces either by dedicated ducting or by dumping the fresh air into the return side of central duct systems in place for HVAC. When the HVAC is conditioning air, the negative pressure in return air ducts work in concert with the ERV fan, whereas routing fresh air into the positive-pressure supply ducts would introduce opposing pressure against ERV fan operations. Dumping fresh air into the return air duct serves to distribute the air throughout the house and feeds every room with a supply vent/grille, but only if the HVAC blower fan is operating. Unfortunately, if the ERV is operating when the HVAC is not (which is common), the fresh air routes backward through the return air ductwork and out any return air grilles. Since most HVAC installations use central return air vents in just a few large open spaces, the fresh air never reaches the small rooms where it is most needed (bedrooms during sleeping).


Another problem with most ERV installations is that fresh air is not filtered before being dumped into living spaces. ERVs typically have one very coarse filter, to catch leaves and other large debris, but most homeowners desire fine filtration to catch dust, pollen, and some mold spores. The only way for outside air from the ERV to be fine filtered is for the fresh air dump to occur on the return air side of HVAC ductwork, while the HVAC blower fan is running. The fine filter on HVAC systems otherwise provides resistance to the dump from the ERV, which then pushes the fresh air backward through the return side ductwork and out into living spaces through return air grilles; these are often just a few central returns in large open spaces.


That was the circumstance in the case study home, and CO2 readings rapidly rose well above healthy thresholds in smaller rooms with people; notably bedrooms during sleeping hours. In consultation with the builder, HVAC subcontractor, and ERV manufacturer (Honeywell), the decision was made to wire together the ERV and HVAC so that its blower fan would operate whenever the ERV ran. That non-standard solution resolved the problem of fresh air distribution in the case home, but it added the operation and energy demand of another mechanical system. If this arrangement seems excessive, the alternative is dedicated ERV ductwork, but then fresh air is not fine-filtered, and there will still be stale zones unless the duct network can supply fresh air in adequate measure to every room in the house; at that point, there might as well be a whole house ducted HVAC system.


Most people think about the energy demand of an ERV unit when they consider energy implications of mechanical ventilation, but the total impact is far higher than just operating the ERV. Again, since factors are variable by size, home, and practices, we will use the actual installation and operations history of the case project as illustration. When the home was first occupied, the ERV was set to run continuously at the low speed (80 CFM), with speed booster switches in bathrooms to improve functional ventilation (200 CFM) for short timed periods. ERV continuous operation was recommended at the outset to flush indoor air of odors and VOCs from the off-gassing of new building materials, but even with 24/7 ERV operation, CO2 rose rapidly above healthy levels in bedrooms with sleeping occupants. As noted above, we then wired the HVAC blower (fan only) to run whenever the ERV operated; this required extra energy when the HVAC system was not already called for by the thermostat.


The energy used directly by the ERV running continuously in the case home, and the HVAC blower fan when needed, was pacing toward an annualized cost of $170 at the local utility rate of ten cents per kwh. Of this total energy draw, the blower fan was demanding about as much energy as the ERV; linking the two roughly doubled energy use. The annual 1,700 kwhs is significant as an energy draw, raw dollar cost, and percentage of total household energy use. That level and intensity of energy may be concerning, and yet there are further implications. Even though the ERV is designed to recover some of the energy lost from exhausted air, the fractional recovery means adding more load to HVAC operations. The energy performance specification on the Honeywell ERV used in the case project offers the following:


Supply Temperature

Net Supply

Air Flow

Average

Power

Sensible Recovery

Apparent Sensible

CFM

Watts

Efficiency %

Effectiveness %

32

51

58

65

76

32

80

76

65

73

32

118

96

62

70

5

55

59

52

78

Total Recovery Efficiency = 34%


These are sample data points, but a few broad conclusions can be drawn. First, efficiency and energy recovery worsens with wider variance between indoor and outdoor temperatures, and with higher fan speeds. Second, even in the best scenarios of these samples, about a quarter of the energy is lost from the exhausted air, and that requires more operation and energy from the HVAC system.


Another area of energy loss occurs from radiant heat transfer across the pipe walls of the two ducts on the exterior side of the ERV. Since ERVs are not recommended to be hard-fixed on exterior walls, duct pipes (commonly sheet metal) are used to conduit air between the ERV and the exterior, penetrating through the thermal envelope. The inbound pipe rapidly assumes the temperature of the outdoor air, and the metal wall of the pipe becomes a conductive coil to indoor air. Even the outbound pipe will be cooler (in heating season) or warmer (in cooling season) than indoor preference, and both of these pipes radiate unwanted temperatures into adjacent spaces and require more HVAC use and energy demand. Here is an image of these pipes from the case project with outdoor temperature at 32℉ and indoor thermostat at 67℉: 


While the temperature spot reader is pointed to the collar of the pipe as it passes through the thermal envelope (yet another compromise and energy implication), note the cold blue color of the inbound (upper) pipe in the thermal image. The color differential between the upper and lower pipe illustrates lost energy in the exchange; the warm(er) air in the outbound (lower) pipe is lost energy that was not fully recovered in the ERV. We noted that direct electricity costs to run the ERV continuously and the HVAC blower fan (when needed) amounted to $170 annually. The other costs are impossible to measure precisely; air and conductive leakage around the collar of the penetration through the thermal envelope, and increased HVAC needs due to radiant transfer from ERV pipes on the exterior side, and losses that cannot be fully recovered in the ERV heat exchanger. The total cost would easily exceed $200 annually, and maybe as much as $300.


When strong indoor odors from adhesives and new building materials began to ebb, we started reducing run times of the ERV while continuing to monitor CO2 levels. This started with nonuse of the ERV during periods when homeowners were away, and then gradual cutbacks until a pattern was established to keep CO2 below 900 ppm while running the ERV as little as possible. This took experimentation over time with a CO2 meter and timing device, but the end result was worth the effort; running the ERV for 25 hours per week, at strategic times, was the minimum for the case house of 2,500 square feet and two-three occupants (no pets). That is just over one-seventh the runtime compared with continuous operation, at least 85% reduction in energy use, and at least $170 saved in electricity bills annually.


Manufacturer and industry-standard formulas for sizing and running mechanical ventilation are excessive because they need to account for the worst possible conditions. Since every home has different rates of air leakage and CO2 infusion (number of people and pets) and absorption (sequestration from indoor plants), we recommend homeowners invest in a small meter to test each space of the house, and in their specific and typical operational conditions. Homeowners who prefer automated systems might consider installing a CO2 detector and control package that would automate runtimes of mechanical ventilation equipment as needed.


In addition to ongoing operational costs of mechanical ventilation, there is significant initial cost at installation, both in dollars and ecological impact from embodied energy. Typical ERV installation for an average-sized home today will cost $4,125, including the ERV, ductwork, fittings, registers, labor, and markup; the same system with an HRV averages $5,375 (Holladay, 2018). Either of these approaches is a significant additional cost to the HVAC system, yet as we noted in this chapter and previous, every modern home in the U.S.–if built with quality–needs a system for air exchange for healthy living. We turn now to alternative methods, starting with the least sophistication and least costly.


The simplest exercise to exchange air is opening windows or doors. This costs nothing for direct operation of the activity, but unconditioned air allowed in from the outside likely requires more energy from the HVAC system. The outdoor air is also unfiltered, and humidity levels may be suboptimal. This basic approach would also require careful monitoring of indoor CO2 levels and a willingness to personally act when necessary. Since the most problematic air quality concerns surround bedrooms while sleeping, one low-tech solution is cracking a bedroom window and running a bath fan through the night. There is a science that drives designs for optimal natural ventilation; the details are beyond the scope of this project, but techniques include wind-driven, buoyancy-driven, and night-cooling ventilation. 


Another low-tech solution is to run exhaust fans strategically. Bath fans could be run more frequently, either manually, or on timers. If a range hood vents to the outside, it could also be employed in the same fashion. Some houses are equipped with whole-house attic fans; these significantly compromise insulating value in an important plane of the thermal envelope, but they can also be used to ventilate the home. Using any of these systems draws outside air into the home through weak links; door and window seals and air gaps around envelope penetrations. The air drawn in through this negative-pressure technique is unfiltered, unconditioned, and it may add unwanted humidity. Installation cost for this range of solutions is minimal, since the approach uses exhaust fans already in place. Operational energy includes longer uses of fans, and greater demand for HVAC to make up for lost energy in the unrecovered exhausted air.


Yet another technique is passive ducted systems. This typically combines a central ducted HVAC system with a 3-4 inch PVC pipe installed from the outside to the return air side of the HVAC unit. This is similar installation to the ERV/HRV, but with no operable equipment between the exterior exposure and the return air plenum, and the pipe in PVC is a much better insulator than the sheet metal most often used with mechanical ventilation. When the HVAC blower fan runs, it creates negative pressure on the return air side of the air handler, and the open pipe will naturally draw in outside air. The fresh air in this system does get fine-filtered, since it is immediately drawn through the HVAC filter, but it is unconditioned and may have suboptimal humidity levels. Installation cost is low and would include PVC pipe, a few collars, and some kind of screen outside to keep animals out. Operational energy would be increased HVAC operations to condition the raw outdoor air.


Single-room solutions are popping onto the market, primarily for retrofit situations, but they could also be designed into new buildings. The most common of this type is paired devices installed in exterior walls on opposite sides of the room or house. They work in tandem with one drawing while the other vents; the vented air warms (or cools) a heatsink that then conditions fresh air passing in the opposite direction when the two units reverse. This system recovers energy like an ERV, but there is no fine-filtering or humidity control, and the cost is currently much higher per CFM than an ERV. These devices could work well for tiny homes, but they are not adequate for larger or multi-room houses.


The only solution that meets the combined interests of energy recovery, fine-filtering, humidity control, and adequate volume and distribution in multi-room houses in the ERV/HRV mated to a central ducted HVAC system. Even that requires the non-orthodox protocol of running the HVAC blower fan whenever the ERV/HRV runs. Even though mechanical ventilation is costly both at installation and in ongoing operations, our team sees no better solution at this time to meet the many and combined needs of providing healthy indoor air quality.


Water Heating

Heating water costs Americans 13% of their overall household energy budget, on average. A decade ago, thermal solar systems (direct water heating) had better rates of return on investment than solar PV. However, thermal solar systems are challenging to use and maintain, especially in climates that endure freezing temperatures. Also, while thermal solar systems had already bottomed out in price, active PV systems kept falling dramatically in price. For those reasons, the recommendation today clearly favors PV systems, even if the energy produced goes to heating water conventionally with resistance elements.


The most efficient direct energy source for heating water is with gas, but we continue to argue for electricity-only systems to eliminate or reduce harmful fossil fuel emissions. Electric hot water heating can be either heat pump or resistance, and the latter in tanks or on-demand tankless. The most common U.S. application is electric resistance tanked systems; they are least costly at installation, simple solid-state technology, and the storage feature is valued to smooth out variability of energy (either availability or level). Heat pump water heaters are relatively new, are significantly more costly at installation, and have much greater complexity and embodied energy. Electric tankless systems are also relatively new at full household scale, they are limited in hot water volume flow, and they offer no hot water during disruption of electricity service.


Unless new technologies change these trade-off dynamics, we recommend the basic electric element hot water heater, especially when paired with on site solar PV (see Chapter 3). The tanked system provides service during short energy disruptions, allows timing to use energy during off-peak periods when grid-tied, and it can utilize energy from waste heat, such as the geothermal desuperheater explained above. The best practices for reducing energy and cost in water heating revolve around reducing use; we offer a few suggestions here that may not be intuitively known.


Bathing needs are the highest demand of hot water for most households. In addition to taking shorter showers, or shallower baths, a reduced flow of water can make a big difference. Shower heads that come standard with shower valve sets typically allow water flow at 2.5 gallons per minute (GPM) or higher. Comfortable low-flow shower heads can be found at 0.5 GPM; that change alone reduces hot water energy and cost by 80% for showering. When building new, reducing the diameter of supply pipes to hot water fixtures reduces the energy loss when hot water cools while sitting between the water heater and the faucet during periods of nonuse. Standard water supply pipes are ½” diameter or larger; we find that ⅜” is adequate for volume, and that also reduces overall water use, as less is wasted while waiting for the hot water to arrive.


Common human behavior with faucets that have a single handle mixing valve is to push the handle straight up to the middle position, demanding a mix of hot and cold water. Dual-handle fixtures minimize the inadvertent or subconscious use and waste of hot water. Clothes washing is another operation where hot water can be reduced. Improvements with detergents mean that most clothes can be laundered in cold water with similar performance to hot water washing. If the homeowner requires hot water for clothes washing, front-load washers use far less water overall than top-load machines.

Lighting

Most choices made in the home building process have immediate financial implications. Many upgrades that are considered for sustainability objectives are more costly at the construction phase, while the benefits of those choices often accrue over long periods, in some cases indefinitely. The comparison of a one-time, immediate, and known cost against a continuous, long-term stream of expected benefits, is a challenging task for the human mind. We’ve provided calculators to distill these complex time-dimensional analyses into simpler metrics that help us make informed choices, and we’ve shown cases where environmental choices are at times economically positive, negative, and neutral. One case that hardly needs a calculator to understand the economic and ecological win-win, is light bulbs. 


Incandescent bulbs have been the mainstay in residential lighting for more than a hundred years, though they are in the process of phasing out by a combination of market competition and government regulation. Less than 10% of the energy demanded by incandescent bulbs is used for light; the rest is wasted as heat, and that belies their egregious inefficiency as a light source. Improving the light-to-heat ratio has driven development of new bulb technologies, where today light-emitting diode (LED) bulbs provide the most efficient and cost-effective choice. LED bulbs are typically six times more efficient than incandescents that produce the same amount of light, and they typically last twenty times longer. Costing just 2-5 times more than incandescents of equal lumens, LEDs make economic sense just on price and longevity alone; adding the energy efficiency element simply strengthens the argument for LEDs, which the following case details.


Replacing a standard 60-watt incandescent bulb with an LED bulb of equal brightness (lumens) will today repay the investment in less than six months, and the LED bulb will typically operate for another 22 years, returning over 7,000% on the financial investment, all while using one-sixth of the energy and far less embodied energy over the 22+ year period of the bulb. This six-month payback assumes the old bulb as sunk cost; if starting without any bulbs, the payback on choosing an LED over an incandescent is less than four months. Here are the assumptions built into the payback models:


    60-watt incandescent (A19) bulb replaced with 10-watt LED bulb

    $3.00 cost of LED bulb (cheaper by the box) vs. $0.99 for incandescent

    $0.10/kWh effective price for electricity (faster payback at higher rates)

    3 hours per day is the average daily use/operation for the life of the bulb

    25,000 hours assumed overall life of the LED bulb, 1,000 for incandescent


There are many free web-based calculators to help with this assessment; these figures were drawn from: http://www.bulbs.com/learning/energycalc.aspx. In the early development of LED bulbs, they were limited in color options and were aesthetically displeasing to many. Other shortcoming were that early LED bulbs were not dimmable and their design made the light cast narrowly one-directional. Over the past few years, even while prices of LED bulbs have fallen precipitously, the technology now offers dimming, multi-directional light casting, and a full spectrum of light choices, even near perfect replication of the incandescent bulb. Compact Fluorescent Lamps (CFLs) were the first residential replacements for incandescent bulbs, but they were soon overtaken by LEDs on nearly every important criteria (efficiency, colors, price, durability and longevity). CFLs also contain mercury which, as a neurotoxin, needs special care at end of life.


LED lighting is an upgrade that clearly warrants spending more at installation for the sake of the known and attractive long-term stream of benefits. LEDs not only offer a favorable financial return on investment, but compared to CFLs and incandescent bulbs, they also incur by far the lowest overall (lifetime) embodied energy, and the lowest overall operational energy. The most energy-efficient option is clearly the most desireable. Most homeowners believe and act on the assumption that the same logic applies to appliances, but the following analysis should reorient their perspectives.


Appliances

Home appliances are a significant investment for most U.S households. Not only are they expensive to purchase, new and/or replace, but they are also a significant part of the household energy footprint. Given that major appliances have a relatively long life, decisions at the outset have long-term energy and cost commitments. From the most basic environmental perspective, the primary guide should be to purchase only as much appliance as needed. Refrigerators, for example, have grown in size and convenience (e.g., automatic ice maker), with little thought to resource use, embodied energy in manufacture, and operational energy over years of service. There is even some evidence (Kleiman, 2015; Kaplan, 2018) that larger fridge space simply shelves more forgotten foods that eventually get thrown away as waste; another environmental and humanitarian disappointment in a world where many do not have enough to eat. Size of appliance often has implications for water use as well, as is the case for dishwashers and clothes washers. In every case, purchase the size that meets your needs most of the time rather than sizing for every potential demand.


There is no one right choice of appliance for every household, but we feel that a few principles can lead to selections with better environmental and financial outcomes. While most appliances involve trade-offs of higher cost for greater efficiency, the refrigerator is an exception. The simple two-door, top freezer models are generally the most efficient and the least costly. Automatic ice makers are convenient, but they compromise efficiency, increase energy use, are the most probable component to break, and they take copious space in the freezer. Consider whether all of that is worth the sacrifice of handling ice manually with trays. 


What is the value of energy efficiency in appliances? Most appliance manufacturers comply with the voluntary Energy Star program; this provides energy information to consumers, including an expected annual energy cost for operating the appliance. Other than the refrigerator noted above, appliances have a trade-off relationship between initial cost and energy efficiency. While the annual energy cost from the manufacturer is helpful, a full lifetime assessment still requires the consumer to do complex math, or uses a calculator, to discern the value of any upcharge.


To test the value of energy efficiency, I personally visited two big-box appliance retailers and recorded sales price and annual energy cost data from the Energy Guide label. I also gathered information from numerous online retailers. Among the large appliances, I found ZERO cases of an upgrade making sense on financial return, and none were even close to breaking even over expected lifespan. The energy and cost savings from more efficient appliances are simply too small to recover the initial premium cost of the unit. Though we have built an online calculator for this purpose, a few scenarios help illustrate this story. Since appliances have different expected lifespans, the following charts provide upgrade thresholds at four levels, and for lifetime expectancies of five, ten, and 20 years.


5-year analysis, or what might be considered for small appliances

Dollar value (annually) of reduced energy use expected from upgraded/premium appliance

Maximum additional cost paid for this premium investment to break even in 5 yrs

$5

$15

$10

$29

$15

$43

$20

$57

Financial Model Assumptions (no inclusion of environmental cost of energy production):

  1. Cost of funds: 4.5%, proxy rate for 30-year mortgage (higher COFs, lower max. cost)

  2. Rate of energy inflation 3.0%: conservative annual escalator, given historical trends

  3. Payback calculator hosted at: http://18.213.234.181/housing 


As an example, if two appliance models are being considered, and the annual expected energy cost is $10 less for the more expensive appliance, the most that should be paid as a premium for the more expensive–and more energy efficient–unit is $29. Appliances purchased for a new home, or with an existing home, are often part of mortgage financing, so 4.5% cost of funds offers a reasonable proxy. For homeowners who replace or upgrade existing appliances, the opportunity cost is likely closer to the 7-10% range, since household funds spent on new appliances are funds not invested. Cost of funds at 8%, which is a suitable proxy for long term average annual returns on a diversified investment portfolio (equities and fixed income assets), yields the following maximum premiums:


5-year analysis, considered for small appliances, but with 8% COF

Dollar value (annually) of reduced energy use expected from upgraded/premium appliance

Maximum additional cost paid for this premium investment to break even in 5 yrs

$5

$14 (vs. $15 for 4.5% COF)

$10

$27 (vs. $29 for 4.5% COF)

$15

$40 (vs. $43 for 4.5% COF)

$20

$54 (vs. $57 for 4.5% COF)

Financial Model Assumptions (no inclusion of environmental cost of energy production):

  1. Cost of funds: 8%, proxy rate for diversified (equity and fixed income) investments

  2. Rate of energy inflation 3.0%: conservative annual escalator, given historical trends

  3. Payback calculator hosted at: http://18.213.234.181/housing 


The difference in viable premiums is even more stark for longer time periods, which we will demonstrate again in the 20-year analysis. But first, here is the scenario chart for appliances with a medium term expected life of ten years.


10-year analysis, or what might be considered for large appliances

Dollar value (annually) of reduced energy use expected from upgraded/premium appliance

Maximum additional cost paid for this premium investment to break even in 10 yrs

$5

$37

$10

$73

$20

$146

$50

$365

Financial Model Assumptions (no inclusion of environmental cost of energy production):

  1. Cost of funds: 4.5%, proxy rate for 30-year mortgage (higher COFs, lower max. cost)

  2. Rate of energy inflation 3.0%: conservative annual escalator, given historical trends

  3. Payback calculator hosted at: http://18.213.234.181/housing 


To use and interpret these charts, calculate the difference in the expected annual energy cost (from Energy Guide label) between two models of the same appliance, then identify the closest match in the left-hand column. The corresponding premium cost in the right-hand column is the most that should be spent on the more efficient model for it to break even over its expected life. While these charts provide some snapshot thresholds, exact return on investment can be obtained by inputting your specific data points into our online calculator; see URL below in the 20-year analysis.


20-year analysis, to be considered for large, longer-life appliances

Dollar value (annually) of reduced energy use expected from upgraded/premium appliance

Maximum additional cost paid for this premium investment to break even in 20 yrs

$5

$77 for 4.5%; $58 for 8% COF

$10

$153 for 4.5%; $115 for 8% COF

$20

$306 for 4.5%; $230 for 8% COF

$50

$764 for 4.5%; $574 for 8% COF

Financial Model Assumptions (no inclusion of environmental cost of energy production):

  1. Cost of funds: 4.5% (mortgage proxy) and 8.0% (investment return proxy)

  2. Rate of energy inflation 3.0%: conservative annual escalator, given historical trends

  3. Payback calculator hosted at: http://18.213.234.181/housing 


In addition to financial return on investments, models that are more energy efficient typically have more components and greater complexity. They therefore have greater embodied energy in resource use and manufacturing, they have more parts and systems to degrade and break, and they will likely be more costly to repair. For those reasons they may also have shorter usable life spans, which takes a heavier toll on resources used per service unit, and for recycling or disposal (landfill) at end of life.


We’ve already noted previously in this book that no building or systems elements of a house have a better ratio of operational energy benefit to embodied energy cost than solar PV, and solar PV offers the best financial return on investment as well. Therefore, if solar PV is installed on a home, energy efficiency in appliances and equipment recede in importance. We have found no upgrades in equipment or appliances that on the grounds of energy efficiency should be selected instead of solar PV, or scaling up solar PV if necessary. This is an important point worth repeating in different words: scaling up solar PV to power the most basic appliances and equipment is far less damaging to the environment in embodied energy than purchasing more energy-efficient appliances and equipment to require a smaller solar array. Adding even more favor is the financial return on investment, which is positive and attractive for solar PV, while negative and discouraging for appliance and equipment upgrades.


Even if solar PV is not available, homeowners are still stuck with the very poor financial return on investment for appliance and equipment upgrades, and the ecological impact is mixed at best. The additional embodied energy of each unit would need to be compared against the lifetime energy savings. There are too many permutations to offer definitive and broad answers to this concern, but our sense about most choices, given our extensive analysis across many systems, is that very few (if any) upgrades offer net ecological benefit. Additionally, the opportunity cost of buying premium appliances and equipment, which can quickly sum to tens of thousands of dollars, could be progress in reducing ecological harm in other ways, such as transitioning to EV transportation.


Many homeowners select appliances and equipment on a wide range of factors, including size, color, features and aesthetics. Our team is not discouraging purchase of any system other than the most basic model; rather, our purpose is to inform choices on the basis of overall ecological and financial impact. We invite consumers to disaggregate ecology from other factors, and if the overall ecological impact is the highest priority, that will guide them to the most basic units; these will also be the least costly, which may repurpose household resources to other conservation efforts.


Here are a few principles applied to specific appliances. Many dishwashers will clean sufficiently in a cycle of less time and operation than standard or default settings, and length of runtime will have the greatest impact on overall energy use. Look for dishwasher models that offer short(er) cycle settings. Another way to use less energy with a dishwasher is to spurn the automatic dry setting in favor of air drying; look for models that allow the internal drying mechanism to be bypassed. Microwave ovens do not vary much in efficiency, per cooking output, but in general cooking by microwave takes much less energy than range cooking. Clothes dryers are another significant energy draw. Give preference to outdoor drying or under a covered outside porch. If homeowners use a clothes dryer, they may wish to pair it with a front-load washer model, as they typically remove more water from clothes in the spin cycle and therefore require less time and energy to dry.


Appliances come with some cross-purpose idiosyncrasies. One example of this is refrigerator lights inside both fridge and freezer compartments; these are typically incandescent bulbs that produce far more heat (90%) than light (10%). In an appliance that uses energy to maintain cold temperatures, it is incredulous that manufacturers design for–and build in–a heat lamp to glow whenever the door is open. Many users will be able to use a fridge without any inside lights, since access if usually gained with sufficient lighting in the room. We encourage homeowners to remove the bulbs and use the fridge for a few weeks without any inside lighting; most will adapt. If lighting inside the refrigerator seems imperative, homeowners can replace incandescent bulbs with LEDs, which produce far less heat while they also use less energy for light. Another cross-purpose feature of the modern fridge is the automatic ice maker, which adds heat into the freezer compartment at each recycle. Purchasing a fridge without an icemaker is the best option for reducing energy consumption, or turning an existing unit off will also help.


Electronics

Electronics is the final category from the pie chart referenced at the beginning of this chapter; powering these devices amounts to 21% of overall residential energy demand, on average. The number and range of electronic devices in this category is enormous, and it varies significantly by user and household. Our aim in this section is to recommend steps to reduce energy waste.


Many electronics draw energy even when they are not in use. These are often referred to as energy vampires for their continuous “sucking” of energy. Media (TV, signal box, recorder) and charging devices are notorious for this; they also tend to be the worst offenders. Placing a surge protector strip between the wall outlet and media devices benefits the homeowner in two ways. First, it protects sensitive equipment from damaging electricity surges while the equipment is active. Second, using the master switch on the surge protector is a convenient way to cut power to these devices when not in use, thereby eliminating the vampire energy draw. The level of energy drawn by electronics in vampire mode is not large for any single device or point in time; however, the cumulative impact of multiple devices drawing energy all the time adds up to significant and unnecessary waste. Chargers for phones, laptops, and other mobile devices should be unplugged when not in use.

Solar: Active vs. Passive

The many benefits of active solar have already been well documented in this book (Chapter 3 and elsewhere). In this section we place solar in the context and integration of other energy systems of the home. Societal messaging on energy has etched in our minds the preeminent value of energy efficiency. Governmental agency involvement, energy labeling, and marketing from manufacturers all send the message that consumers should seek out and purchase the most energy-efficient option their budget can support. Homeowners often reach their budgetary limits trying to upgrade systems, equipment, and appliances. The implicit assumptions accompanying these pressures are that energy-efficient options will save the consumer money in the long run, even though data is scant and simple payback models are misleading. By the time the question of solar installation arises, homeowners have tapped out their resources, and the solar investment looks insurmountable.


This thinking and sequence is backward and damaging, both to individual budgets and to the natural world. An independent and realistic financial assessment, including the cost of funds and energy inflation over the expected life of each investment, turn the tables on this conventional wisdom. Solar PV should be the first priority and messaging needs to reflect the positive and attractive financial return on investment. When household energy is produced onsite by clean and renewable solar PV, the value of energy efficiency in other systems recedes; in some cases to zero. And since the financial return on equipment and appliance upgrades is negative, consumers can avoid those money traps. Homeowners can install the most basic equipment and appliances, which are also the least costly, and least damaging to the environment in embodied energy. When we think solar first, it changes the metrics entirely on other energy choices; see side-by-side comparison of paradigms below:


Paradigm Prominence 

Old Entrenched Orthodoxy

New Paradigm; must emerge

Assumptions/Sequence

Energy-Efficiency first, Solar PV second (or later, or never)

Solar PV first, then select basic, least-cost equipment/appliances

Step 1, and result

Limited resources spent on equipment/appliance upgrades that produce negative returns.

Limited resources spent on solar PV, but positive and attractive returns begin immediately.

Step 2, and result

No resources left for solar PV or other clean energy options

No resources needed for energy efficiency upgrades in equipment

Energy impact overall

Possibly less energy used, but still fossil fuel laden (from grid)

Possibly more energy used, but all clean and renewable (onsite)

Ecolog. impact overall

Highest embodied & still-high operational energy impact 

Lowest embodied energy, and lowest operational energy impact 

Financial impact overall

Negative financial returns on equip./appliances and no solar bens. to offset (net negative)

Attractive/strong financial returns on solar PV and no drag from equip/appliances (net positive)


Prioritizing solar PV over equipment and appliance upgrades (and thermal envelope upgrades; see Chapters 5 and 6) gets the homeowner all the way to zero net energy and can eliminate the household footprint of harmful pollution and climate emissions. Instead of that choice requiring a financial sacrifice, the system pays attractive returns (see Chapter 3), and the embodied energy in solar PV is relatively small and can be offset with surplus production. This sequence frees the homeowner from pressure to upgrade equipment and appliances (and thermal envelope) on the basis of energy efficiency; all of those choices have high initial investments, negative financial returns, higher embodied energy in the products, higher net operational energy, and worse overall environmental impact. 


This is worth stating in a different way. Building a code-compliant home, with the most simple and basic equipment and appliances, is the least expensive housing package. Adding solar PV actually makes that package even less costly, because the return on investment is so strong. And by adding solar PV in size to produce all the energy (cleaner, renewable) that the household demands, there is no need, pressure, or even rationale to upgrade other systems on energy efficiency (LED lighting excepted). What does this mean for passive solar priority and integration?


Passive solar comes with significant tradeoffs and complexities; be sure to read about passive solar misconceptions in the previous chapter. Since active systems have such strong net environmental benefits (good ratio of operational energy benefits to embodied energy costs), and net financial benefits (positive and attractive return on investment), priority therefore should favor active over passive systems. Active solar also offers much greater flexibility and range in orientation than passive, which needs to be within a few degrees of true south to achieve net benefits. Still, since humans prefer living in homes with some natural light, we accept windows as weak links in the thermal envelope, and if the site, orientation, and design of the house can accommodate placement of windows on southern elevations, some limited passive gains can be achieved. In U.S. climates with heating seasons, windows on the south will permit passive heat gain when it is desired, and they are shielded from prevailing north and northwest winds from the jet stream. Prioritizing active solar, with its financial and environmental benefits, takes pressure off needing to augment with precise and complex passive design. We believe it is not worth wedging in a passive solar plan if it requires functional or livable sacrifices. 


With active solar PV providing (net) all domestic energy demand, pinching every last watt from household use or other systems is not so important. It is still preferable to reduce energy use by careful consumption and behaviors, as that would require a smaller solar array and less embodied energy impact from that system. However, upgrades to the thermal envelope or equipment and appliances worsen overall impact and returns on both financial and ecological metrics.

Battery Storage

When energy is produced onsite, such as with solar PV, the question of battery backup and storage often arises. Even though battery chemistry and technology has evolved impressively, and continues to improve with dramatic strides, it is still relatively expensive to store energy. Whether battery storage makes sense depends on the circumstances of electric utility connections and policies. We will review each of several scenarios, but let’s start with cost and return on investment. Tesla is one of the market leaders in home battery products with their Powerwall product, now in its second generation with the following specifications:


Price: $7,250 with supporting hardware

 Power: 7 kW peak / 5 kW continuous

 Capacity: 13.5 kWh useable capacity

 Warranty: 10 years, expect 15 year life


Tesla estimates installation costs of $1,000-$3,000, bringing total installed cost to roughly $9,000 for one Powerwall, or $18,000 for two; homes with moderate energy demand will need at least two of this size battery. Using the $18,000 installed price with our payback calculator and 4.5% cost of funds, a homeowner would need $2,400 in annual benefits to break even on their investment over 10 years (warranted life), or $1,500 to break even over 15 years (expected life). Breaking that down to monthly figures ($125-$200/month), it becomes quickly evident that batteries have not yet reached economic viability when compared to commercial utility rates. Remember that this premium is just for storage; not for the energy production or use.


Most U.S. homeowners are connected to electricity grids and to utilities that offer net metering for distributed solar installations. Utilities differ in their approaches to customer-installed solar production; the following chart attempts to classify and qualify some of the common policies and regulations:

Utility approaches to Solar PV

Provisions, Policies, and Regulations

1.

Generous

Net meter with retail price credit in both directions

2.

Accommodative

Net meter with wholesale price credit on surpluses

3.

Somewhat accommodative

Net meter with no customer credit beyond net zero

4.

Neutral to both parties

Net meter with low monthly connection fee (less than $10)

5.

Somewhat restrictive

Net meter with high monthly connection fee ($10-$20)

6.

Restrictive

No net metering; do not support and/or permit


The case home falls in the neutral classification (#4 above), with net meter provision and a monthly connection fee of $8.40 (with taxes). Since the utility developed the connection to the case home, and maintains the full infrastructure to provide electricity when demanded, it is reasonable for to charge a fee for service, even for net monthly solar surpluses. Another way to view this is to consider the $8.40 a monthly fee for battery storage and backup. When solar PV produces more energy than demanded on site the surplus flows into the grid with credit/kWh. Then when the home demands more energy than is being produced on site, the grid provides the back-up, drawing on the credit. At a monthly price of $8.40, two Tesla Powerwalls would need to drop to an installed price of $800 to break even in 10 years, or $1,200 for break even in 15 years; it is immediately clear that battery prices are not close to those thresholds.


The only economic case for home battery storage today is when the cost of extending the utility grid to the residence is high. When a new house is constructed some distance from an existing grid, the utility will charge the resident the cost of extending and developing the service to that remote location. Using current prices for two Tesla Powerwalls ($18,000), and the case home’s utility service fee of $8.40/month, our calculator offers premium upgrade thresholds of $800 and $1,200, respectively, for 10 and 15 year paybacks. In other words, it would be economically viable to select battery storage if the utility extension fee were $17,200 or more for 10 years of battery life, or $16,800 or more for 15 years of battery life.


Other than extreme distance from existing utility grids, none of the scenarios above currently provide an economic case for home batteries connected to solar. If electric utilities grow hostile to distributed solar in the future, and squeeze customers with outrageous fees and connection charges, it is possible that moving off-grid could become economically viable. However, it is difficult to imagine that scenario, unless battery prices fall to a fraction of their current cost.


If one motivation for cutting connection with electric utilities is because of their ecological impact, it should be noted that batteries also have environmental costs. The manufacturing process employs resources, some of which are relatively scarce and limited, and batteries degrade over time and eventually need replaced. Fortunately batteries of this size are now being designed and made to be recycled or reused at end of life, but even that process requires more energy. Technological advances in the future could make home battery storage both viable and preferable; some systems already being tested include integrating vehicle batteries with home systems, managing residential energy production and storage with smart grid communications to more effectively manage demand peaks and valleys, and limited modular mini-grid systems.

Electric Vehicles

Vehicle transportation accounts for more than a quarter of the American energy footprint and is a significant contributor to U.S. climate emissions, and other harmful pollutants. In the era of fossil fuel power we did not connect the systems of transportation and home energy; however, with solar energy now viable for residential production, we need to consider these as integrated systems. The availability and affordability of long-range electric vehicles (EVs) is occurring right on the heels of Solar PV becoming affordable and a good financial investment for homeowners.


Electric vehicles already have an advantage over ICE (internal combustion engines) vehicles in efficiency and overall operating costs (Carrington, 2017). Only about 15% of gasoline energy goes to moving an ICE vehicle; that improves slightly to 20% for diesel motors (Shah, 2009). The energy lost is wasted in heat, first from the motor, and then by friction braking. By contrast, more than 90% of the energy stored on board an EV is used to propel the vehicle (Shah, 2009). EVs waste very little energy in the drive train, and they employ regenerative braking to recover much of the kinetic energy when slowing the vehicle. This is evident in the fuel economy ratings as tested by the EPA; all of the pure EVs on the U.S. market in 2018 have MPGe ratings over 100 (EPA, 2018), while most ICE vehicles have overall MPG ratings less than 40.


For houses with the combined features of solar PV availability and suitable parking and charging conditions for EVs, it makes perfect sense to size the solar system to power transportation in addition to household energy demand. That package removes more than 50% of the climate emissions of the average American household, and the strong financial return demonstrated for home use energy is strengthened still further by replacing ICE transportation with EV. Electric utilities often cap residential solar to production in line with historical household use; advocacy is needed to encourage electric utilities to allow PV system sizing to include EV transportation. 


In the section above on battery storage, we argue that home batteries are not yet economically viable, or environmentally preferable, when an electric utility grid is available; why is that different for vehicles? One reason is scale, and the other is energy mix. It is difficult for home battery systems to compete with the enormous scale of commercial energy production and distribution. Electric utilities have a natural monopoly which, if regulated and managed effectively, operate efficiently and offer relatively low service rates. With vehicles, the scale is the same (one vehicle unit and one propulsion system) for EV and ICE technologies, and we already noted the vast difference in efficiencies between the two. Additionally, ICE vehicles use an energy mix that is mostly fossil fuel-based, whereas electric utilities have a larger mix of renewables.  And if the energy powering EVs is produced by residential onsite solar, it is fully renewable.


Battery technology has come of age for transportation, even while it is not yet economically viable for home storage. Ironically, the advent of affordable long-range EVs speeds viability in home storage systems. The economics of home battery storage are stronger without the drag of utility standby fees, but cutting connection to the utility requires battery capacity for worst-case scenarios, which is dramatically more expensive. Integrating EVs as a mobile energy backup provider to the home can reduce standard home battery capacities. Home battery storage would then be sized (smaller) to meed most energy scenarios, with the option of bringing additional energy to the home, from the EV, during worst-case conditions (snow cover on solar panels, or extraordinary energy demand from users). EVs can charge at work or public facilities and bring that stored energy home.

Case Study

The case house was designed from the beginning to produce enough solar energy to power both the home and local transportation. At the time of construction the homeowners operated a plug-in hybrid vehicle with 20-30 miles of EV range, enough for all local driving. The combination of solar sizing and expected home energy needs allowed enough surplus energy to power a long-range all-electric vehicle to be purchased later. The long-range EV is still pending, but the surplus accumulating on the net meter in the interim suggests an appropriate solar sizing (7.2 KW) to accommodate that future demand, even with disappointing energy, envelope, and equipment outcomes on the household side.


Battery storage was not in the immediate plan for the case project, though space was designed into the utility room to accommodate that possible addition in the future. Batteries perform best in moderate temperatures 68-86℉, and fall off significantly in cold conditions. For this reason, we placed the solar inverter in a semi-conditioned utility room, were we also left space for battery storage in the future. In the meantime, the homeowner is satisfied with the neutral utility arrangement of paying $8.40/month to be connected to the electricity grid. The grid accepts surplus energy from solar production, providing credit through the net meter to offset energy demand during periods of high need. Battery storage does not make sense at this time for the case home.


The biggest disappointment in the case project came from the combination of premium thermal envelope and premium geothermal heat pump, which should theoretically use much less energy than the homeowners’ previous residence with a basic code-minimum envelope and basic, air-source, 13-SEER heat pump. As we have shown, the premium package needed the same amount of energy as the basic package; we offered data, analysis, and logic to make sense of this surprising result. One difference between the two units is mechanical ventilation, which we know to be needed in the case home, and in a number of other houses we have tested. Indoor air quality, as it relates to health implications from high CO2 concentrations, is recent in the public health research and in building science; this needs further research, which should help clarify home energy considerations. Until mechanical ventilation systems are able to recover all (or nearly all) of the energy being exhausted, that heat loss further diminishes the value of the strongest insulating elements of the thermal envelope.


We described a number of surprises in the energy systems of the case home. We also had very specific data because we buried temperature probes in the geothermal loop beds, and logged readings and other energy uses with precision. Do the energy outcomes suggest something anomalous with the case home, or does it represent the reality for most homes? Is it possible that homeowners simply do not know of these surprising performance outcomes because they did not identify a benchmark and then gather and compare data after upgrades? We are convinced it is the latter, though we intend to continuously expand data points and a database of homes and systems to bolster confidence and inference with statistical analysis.

Conclusions

Our analysis on energy systems confirms that the most ecologically-friendly house is also the least costly to build, buy, and operate. It starts with planning for electricity as the sole energy source and the combined package of solar PV for house and transportation, a quality-built code-minimum thermal envelope, and a basic air-source heat pump with ducted whole-house distribution. This package alone removes more than half of the average American’s energy footprint, and the basic features impact resources the least in manufacture and construction. Onsite production of energy from solar PV is not only less costly than electricity rates in nearly every region of the U.S., but it offers an attractive return on investment (see Chapter 3).


Homeowners are advised to plan for a system to exhaust CO2-concentrated air from every room in the house; we offer several methods to achieve this, including mechanical ventilation as one option. Air exchanges, while needed for indoor air quality and healthy living, require energy well beyond the direct electricity needed to operate fans. This has a surprising impact on the value of all thermal envelope systems, but most acutely on the highest-performing elements; it further diminishes their relative value.


Energy efficient LED lighting is recommended, as the technology now offers an aesthetic solution for every preference, and the economic and environmental paybacks are clear and strong. Surprisingly, that logic does not extend to other equipment and appliances. These are difficult concepts to grasp, but perhaps a few simple statements can help:


  1. Upgraded equipment and appliances may use less energy, but they cost more initially, and the financial benefits are too small to return anywhere close to breakeven over their lifetime. They are ill-advised for financial reasons.

  2. Upgraded equipment and appliances represent more embodied energy, due to more components and complexity. Because of that complexity, they are more likely to need repairs and likely have shorter life. They are ill-advised from a resource use perspective.

  3. Though upgraded equipment and appliances may use less energy, that becomes less important when the energy source is renewable, such as with onsite solar PV. Embodied energy in solar PV scaling is relatively less damaging than upgrading equipment and appliances, which is ill-advised from an operational energy perspective.

  4. The opportunity costs of upgraded equipment and appliances should be considered for meeting other objectives. By scaling back to basic models, does the homeowner save enough to add solar PV or transition to EV transportation? Both would have more impact, and equipment and appliance upgrades are ill-advised on grounds of opportunity costs.


Here is an example from a recent case to illustrate these trade-offs. In 2015 my team was consulted on a project needing heat pump replacement. Competitive bids were solicited from several local contractors, who were asked to price equipment along the full range of efficiency options. One contractor, proposing the same heat pump brand across several efficiency steps, quoted $5,910 for their most basic 14 SEER heat pump, and $12,160 for their most efficient 25 SEER unit. The more efficient system was claimed to use 3,360 kWhs less energy per year, or about $336 at the current electricity rate, but it would cost $6,250 more than the basic unit. How do we match these values, and consider opportunity costs for the upgrade?


  1. Using our payback calculator at 4.5% cost of funds, the most that should have been paid initially for the upgrade, and that stream of benefits, was $5,000. In other words, the price premium is too high to justify the claimed continuous benefits on financial grounds. 

  2. Thinking of opportunity costs, the $6,250 saved from selecting the basic unit could have purchased a 3.57 KW solar PV system, which would be expected to produce 4,863 kWhs of electricity annually. That is not only more energy than the upgraded model would purport to save, but the PV system will produce energy well beyond the expected 20 year life of the heat pump.


Finally, active solar has much better financial and environmental returns than passive systems and should be prioritized. Passive solar can help, but it is tricky to design for optimal benefit. Battery storage for home use is not yet viable or recommended where the electricity grid is present, but battery advances now make electric vehicles preferable to ICE vehicles on both financial and environmental grounds.

Do’s

-Plan for electricity to be the sole energy medium of the home; reject all fossil fuels
-Design home/roof to accommodate enough solar PV for home and transportation
-Plan to install enough solar PV to power whole house and full electric vehicle(s)
-Consider passive house design principles, but prioritize active solar PV production
-Install basic air-source heat pump HVAC with whole-house distributed duct system
-Plan for ventilation system to exchange indoor air and monitor indoor CO2 levels
-Plan for all light fixtures to accommodate LED bulbs (best if standard A19 base)
-Buy basic appliance models (least costly and lowest overall environmental impact)
-Plan (warm) space for home batteries, but wait for them to reach economic viability
-Begin planning for transition to electric vehicle(s), powered by residential solar PV

Don’t’s

-Don’t invest in any new systems or equipment that uses direct fossil fuel energy
-Don’t assume solar PV is expensive; it actually has strong lifetime financial returns
-Don’t buy a new vehicle powered by fossil fuels; rather, commit to the EV transition
-Don’t wedge-in passive solar if it requires significant sacrifices (aesthetic or operational)
-Don’t select high-efficiency HVAC systems unless clean/renewable energy not available
-Don’t run mechanical ventilation continuously; monitor CO2 levels to time operations
-Don’t assume that LED bulbs have the wrong color; they now come in many hues
-Don’t select upgraded appliances for ecological reasons; simple and basic is best
-Don’t invest in home battery storage if the electricity grid is available; not yet viable
-Don’t discount EVs until you have studied the data and test-driven affordable models